


Introduction
Acute ischemic stroke (AIS) is often caused by a thrombus blocking blood flow in an intracranial artery. The result is ischemia and subsequent infarction of brain tissue, with resulting permanent disability, or, in severe cases, death [1]. The two established treatments for AIS are pharmacological thrombolysis and endovascular treatment (EVT) [2]. Both these treatments aim to minimize brain tissue damage via recanalization of the occluded blood vessel and restoration of blood supply to the brain. The success of any AIS therapy is most commonly measured by the modified Rankin Scale (mRS), a 7-point ordinal clinical scale ranging from 0 (no symptoms at all) to 6 (death) [3]. As clinical outcomes are a result of ischemic infarction, it stands to reason that infarct volume may be used as a surrogate for clinical outcome. Infarct volume measurements may even allow for a more direct assessment of the effect of AIS therapies since they are less confounded by post-stroke events that are unrelated to the treatment. However, currently, it is not entirely clear whether and to what extent changes in tissue imaging markers such as infarct volume translate into changes in clinical outcome. Furthermore, recent evidence suggests that the association of infarct volume and clinical outcome may be tissue-specific, whereby a certain infarct volume in the white matter may have a more deleterious effect on outcomes compared to the same infarct volume in the grey matter [4].
We used a randomized trial sample of AIS patients who underwent EVT to investigate the association of quantitative imaging markers, namely total infarct volume, grey matter infarct volume, white matter infarct volume, and parenchymal hemorrhage volume on 24-h follow-up imaging with clinical outcomes at 90 days.
Methods
Patient sample
This study was a post-hoc analysis of the ESCAPE-NA1 trial (ClinicalTrials.gov: NCT02930018), a multicentric, double-blind, randomized controlled trial that investigated the safety and efficacy of intravenous nerinetide in AIS patients with large vessel occlusion undergoing EVT. Patients were randomized to a single, 2.6 mg/kg dose of intravenous nerinetide or placebo in addition to best medical treatment, including intravenous alteplase if indicated. Patients were eligible for the trial if they had a large vessel occlusion (intracranial internal carotid artery, M1 occlusion or functional M1 occlusion [occlusion of both M2 branches]), moderate to good collaterals (defined as filling ≥50% of the middle cerebral artery territory) and an Alberta Stroke Program Early Computed Tomography Score (ASPECTS) score of 5 or higher. The clinical inclusion criteria were (1) age of 18 years or older, (2) baseline National Institutes of Health Stroke Scale (NIHSS) >5, (3) functional independence prior to the ischemic stroke (Barthel Index score >90), and (4) time since last known well <12 hours. Non-contrast computed tomography (NCCT) and multiphase computed tomography angiography (CTA) at baseline were performed in all patients. Key exclusion criteria were chronic vessel occlusion, absent femoral pulses or other findings that indicate high likelihood of failure to obtain vascular access, pregnancy, weight <45 kg or >120 kg, fatal co-morbid illnesses that would prevent completion of 3-months clinical follow-up, and contraindications to iodinated contrast (e.g., severe contrast allergy or severe renal impairment) and prior treatment with nerinetide. Follow-up imaging (NCCT or diffusion-weighted imaging-magnetic resonance imaging [DWI-MRI]) was performed at 24 hours. The study was approved by the ethics board at each participating center and by the local regulatory authorities. Signed informed consent was obtained from the participants, their legally authorized representatives, or, if required by national laws or regulations, from the investigator after consultation with an independent physician who was not otherwise participating in the trial (“two-physician consent“).
Image analysis
All imaging data (baseline NCCT, multiphase CTA, catheter angiography, and follow-up NCCT and DWI-MRI) were reviewed in consensus readings (i.e., two-physician consensus readings were performed by default for all assessments) by an independent core lab (JO, BM, MJ, CZ, MA, MG, LR) (Supplementary Table 1). Disagreement between two readers were solved by a senior neuroradiologist (MG; 24 years of stroke imaging experience). Core lab members were blinded to clinical outcomes at all times. Total infarct volumes, grey matter infarct volumes, and hemorrhage volumes (in cases with evidence of intraparenchymal hemorrhage on follow-up imaging) were evaluated on 24-h follow-up imaging (NCCT or MRI) by a core lab member (JO, general radiology, 4 years of stroke imaging experience), under the supervisions of a senior neurointerventional radiologist (MG) (Supplementary Table 1 and Supplementary Figure 1). Volumetry was performed through manual planimetric measurements using the open-source software ITK-SNAP (http://www.itksnap.org, Supplementary Figures 1 and 2). White matter infarct volumes were obtained by subtracting grey matter infarct volumes from total infarct volumes (Supplementary Table 2). Total infarct volumes and hemorrhage volumes (if intraparenchymal hemorrhage was present) were manually segmented for all patients with appropriate and technically adequate follow-up imaging (either NCCT or DWI-MRI for infarct volumes and either NCCT or hemorrhage-sensitive MRI sequences [gradient echo or susceptibility weighted imaging]). Tissue-specific infarct volumes were manually segmented separately only for patients with DWI-MRI follow-up imaging since the boundaries are relatively conspicuous on DWI-MRI but often indeterminable on NCCT (Supplementary Table 2). Areas with hemorrhagic transformation and hemorrhages within infarcted areas, but not remote hemorrhages, were included in the infarct volume segmentations.
Outcomes of interest
The primary outcome in this study was the adjusted probability of achieving good functional outcome, defined as mRS 0-2 at 90 days. This probability was derived from a binary logistic regression analysis (see below).
Statistical analysis
Patient baseline characteristics in the entire patient sample and patients with and without good outcome were assessed using descriptive statistics and compared using Wilcoxon rank-sum test, Kruskal-Wallis test, or Fisher’s exact test, as appropriate to the type of data. To investigate the relationship between each quantitative imaging marker and good outcome, we obtained adjusted probabilities of achieving good outcome from multivariable logistic regression analysis. For each imaging marker, a separate regression model was built (Supplementary Table 3). All markers were analyzed as continuous variables. All models included patient age, sex, and baseline NIHSS as adjustment variables. Age and baseline NIHSS were included as adjustment variables because both these variables were repeatedly shown to be strong predictors of post-stroke and post-EVT outcome [5], and as such, could confound the relationship between infarct volume and 90-day mRS. Sex was included as an additional adjustment variable since it is controversial whether there are differences in post-EVT clinical outcomes in women and men that cannot be explained by confounders such as age and NIHSS [6]. In addition to this, the parenchymal hemorrhage model included total infarct volume as an adjustment variable, and the grey matter infarct volume model included white matter infarct volume as an additional adjustment variable and vice versa (Supplementary Table 3). These additional adjustments were made since the observed association of white matter infarct volume and outcome may be confounded by grey matter infarct volume and vice versa.
Predicted probabilities of good outcome with respective 95% confidence intervals (CIs) were plotted against the range of quantitative imaging markers. We then determined the change in total infarct volume that translates into a 1%, 5%, and 10% increase in the probability of mRS 0-2 by using a spline regression, whereby knots were placed based on visual assessment of the data distribution. Improvement of model fit with spline regression over and beyond a linear regression model was tested using a likelihood ratio test. The above-mentioned percentages were chosen based on a landmark study by Cranston et al. [7] that determined the minimally clinically important difference for stroke outcomes to be 1.3%; however, in other studies, this number varies between 1%-10%, depending on the study design and stakeholders questioned [8,9]. Furthermore, a study by Fisher [8] determined that realistic absolute minimal effect sizes for neuroprotective drugs are approximately 5%. Due to the low number of patients with MRI in whom tissue-specific infarct volumes could be obtained and the low number of patients with evidence of parenchymal hemorrhage on 24-h follow-up imaging, spline regression was only performed for total infarct volume.
We performed a sensitivity analysis in which excellent clinical outcome (mRS 0-1 at 90 days) rather than good outcome (mRS 0-2 at 90 days) was used as the dependent variable. Although only 1 reader performed infarct volume measurements, there may be slight differences between measurements when different readers segment infarct volumes. Therefore, inter-rater agreement for tissue-specific infarct volume measurements was assessed in 25 randomly selected patients using Bland-Altman plots. All analyses were performed using Stata version 17 (StataCorp., College Station, TX, USA).
Results
Of the 1,105 patients included in ESCAPE-NA1, follow-up imaging for total infarct volume assessment was available for 1,099 patients (NCCT: n=652, DWI-MRI: n=447) that were included in the analysis. Of the 447 patients with follow-up MRI, diffusion-weighted sequences could be postprocessed and tissue-specific infarct volumes obtained in 358 patients. Appropriate sequences for parenchymal hemorrhage volumetry were available in 1,054 patients. Baseline characteristics, quantitative tissue variables, and clinical outcomes of the study sample are shown in Table 1. Inter-rater agreement between readers was good, with mean differences in volume <3 mL (Supplementary Figure 3).
Adjusted probabilities of mRS 0-2 and quantitative tissue imaging markers
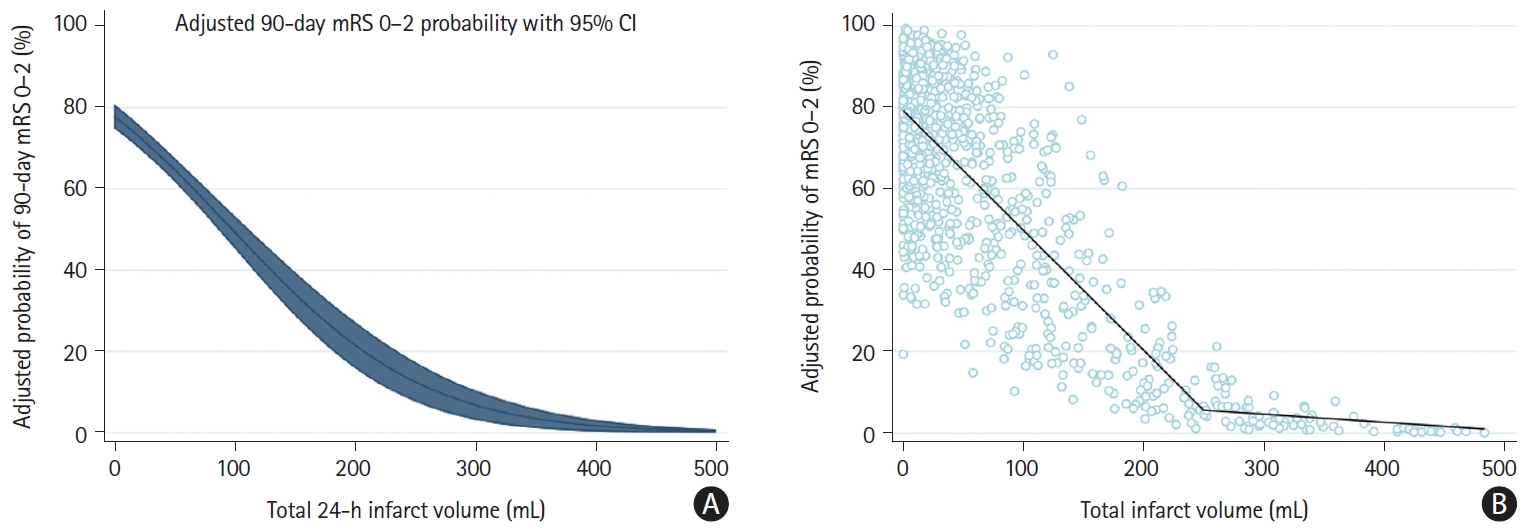
Adjusted probabilities of achieving mRS 0-2 across the range of total infarct volume with respective 95% CIs are depicted in Figure 1A. The relationship between total infarct volume and adjusted mRS 0-2 probability was nearly linear for total infarct volumes up to 250 mL, while the curve plateaued for larger infarct volumes. Adjusted probabilities of good outcomes were near zero for very large infarcts. Based on this observation, a linear spline regression model with a knot at 250 mL was fitted to the total infarct volume data and improved model fit over and beyond a simple linear regression (P [likelihood ratio] <0.01) (Figure 1B). In the range from 0 mL to 250 mL, the decrease in infarct volume required to achieve a 1%, 5%, and 10% increase in the probability of achieving mRS 0-2 was 3.4 mL (95% CI: -3.25 to -3.56), 17.0 mL (95% CI: -16.25 to -17.8), and 34.0 mL (95% CI: -32.5 to -35.6). At infarct volumes above 250 mL, the probability of achieving mRS 0-2 was near zero (Figure 1). When comparing effect size estimates of different co-variates, 1 mL in infarct volume increase had a less detrimental effect on outcome than a 1-point increase in baseline NIHSS or a 1-year increase in age at stroke onset, although the units of these variables are difficult to compare.
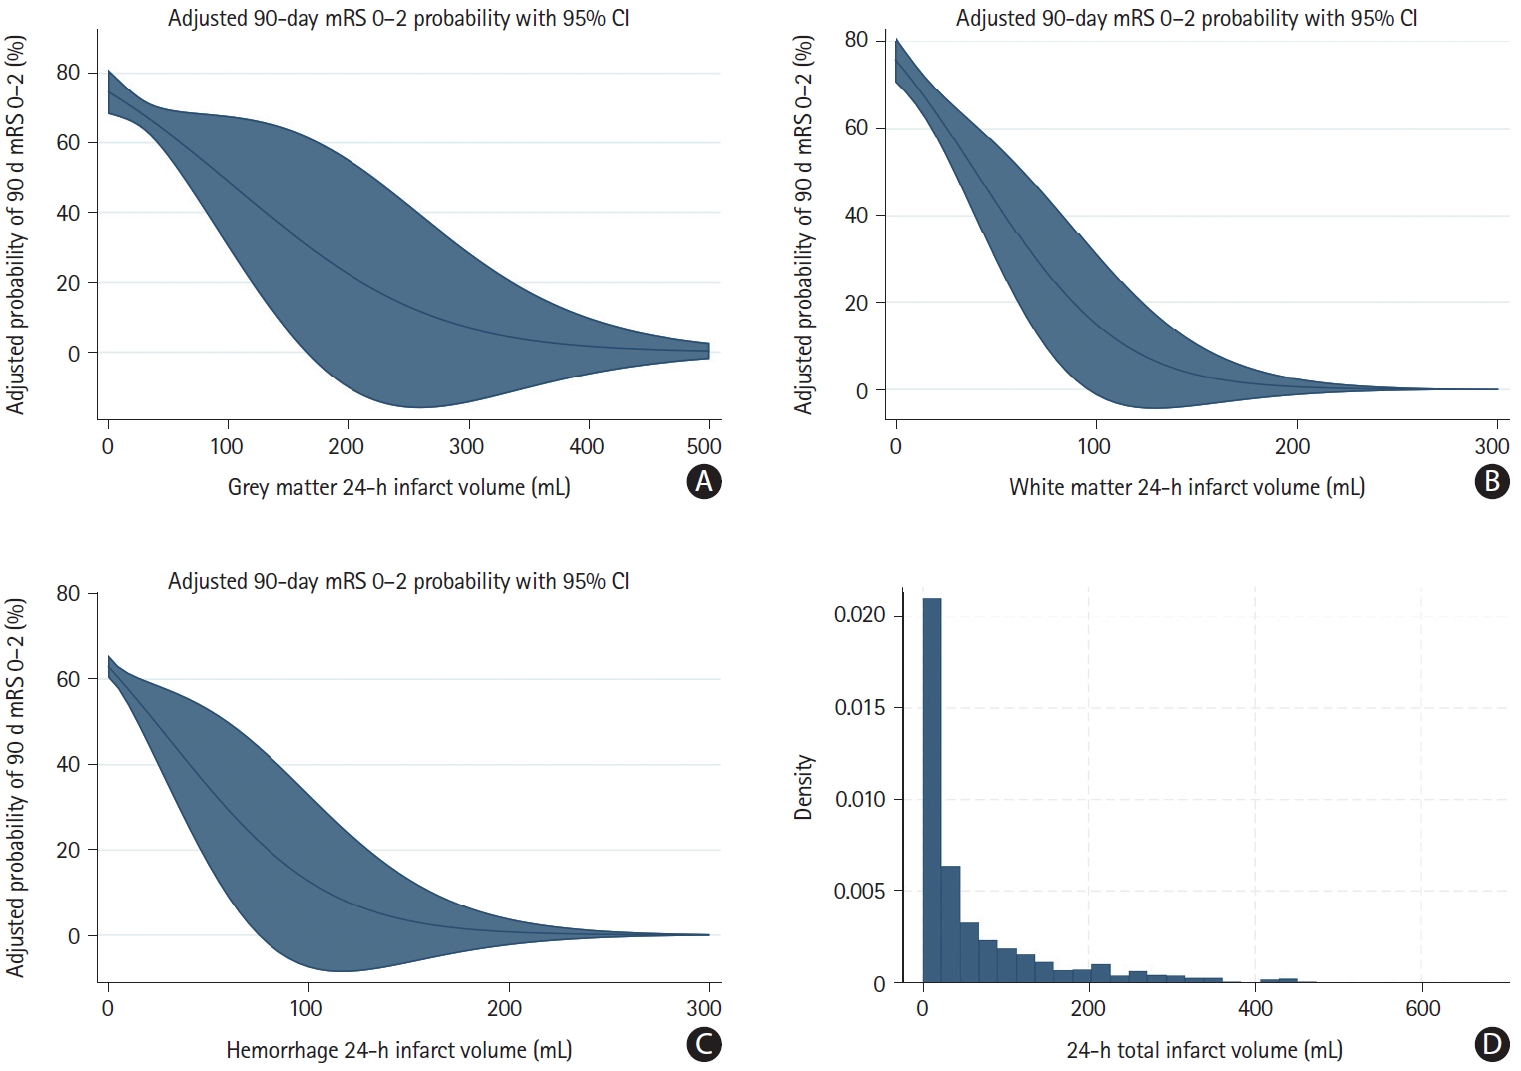
Adjusted probabilities of achieving mRS 0-2 across the range of grey matter infarct volumes, white matter infarct volumes, and hemorrhage volumes with respective 95% CIs are depicted in Figure 2. The relationships of grey matter infarct volume, white matter infarct volume, and parenchymal hemorrhage volume generally showed similar patterns, with near-linear relationships for small and moderate volumes, and near-zero probability of achieving good outcome at the high-volume range (Figure 2). Of note, the decrease in mRS 0-2 probability was steeper per mL increase in white matter infarct volume compared to grey matter infarct volume (Figure 2). However, the association of grey matter infarct volume, white matter infarct volume, and parenchymal hemorrhage volume with adjusted mRS 0-2 probability was highly variable, as indicated by the wide confidence intervals in Figure 2. Therefore, we did not attempt to quantify the exact volume of grey matter infarct volume, white matter infarct volume, and parenchymal hemorrhage volume associated with a 1%, 5%, and 10% increase in mRS 0-2 probability. Histograms illustrating the distribution of infarct volume raw data are shown in Figure 2D (total infarct volume) and Supplementary Figure 4 (grey matter and white matter infarct volume).
Sensitivity analysis
When using mRS 0-1 as the dependent variable, associations of overall infarct volume, tissue-specific infarct volumes, and hemorrhage volume were similar to the main analysis. Adjusted probabilities of achieving mRS 0-1 across the range of grey matter infarct volumes, white matter infarct volumes, and hemorrhage volumes with respective 95% CIs are depicted in Supplementary Figure 5. Changes in total infarct volume associated with a 1%, 5%, and 10% decrease in mRS 0-1 were 5.9 mL, 29.4 mL, and 58.7 mL, respectively.
Discussion
In this post-hoc analysis of the ESCAPE-NA1 trial, a near-linear association between total infarct volume and adjusted probability of achieving good outcome was seen in patients with small to moderately sized infarcts, while the probability of achieving good outcome in patients with very large infarcts was near zero. In the small to moderate infarct range, a decrease in infarct volume of approximately 3.4 mL, 17 mL, and 34 mL was associated with a 1%, 5%, and 10% increase in the probability of achieving good outcome.
Infarct volume reflects the extent of ischemic tissue damage, which is ultimately responsible for the disability AIS patients suffer from. Infarct volume has been shown to be a strong predictor of 90-day clinical outcome, independent of patient age, NIHSS, and other baseline characteristics. Some infarct patterns such as corticospinal tract infarction have a near-deterministic relationship with poor outcomes [4]. Therefore, it stands to reason that infarct volume may be used as a surrogate outcome in AIS research. Compared to the 90-day mRS, which is the standard clinical outcome in clinical AIS research, 24-h infarct volume has several advantages: it requires a much shorter follow-up period, it is not confounded by unrelated clinical events that sometimes make it difficult to detect a treatment effect on the mRS, and imaging patterns may allow us to learn about the mechanisms of actions of certain therapies. For example, an AIS treatment that primarily targets neurons would be expected to reduce grey matter infarct volume more than white matter infarct volume.
However, in order to establish quantitative imaging biomarkers of ischemic tissue damage as valid surrogate outcome markers, a strong and predictable association with clinical outcomes has to be proven. Furthermore, once such a relationship has been established, and if a treatment shows benefit on one of those imaging surrogate outcomes, it should only be considered relevant if this change in surrogate outcomes also results in a change in clinical outcomes that is meaningful to patients. For mRS 0-2, the minimally clinically important difference—i.e., the smallest change that is considered meaningful by patients—ranges between 1% and 10% [7-9].
We previously showed that the strength of the association between infarct volume and clinical outcome depends on infarct size [10]. In the current study, we observed a near linear relationship of total infarct volume up to 250 mL, after which the probability of achieving a good outcome was close to zero. Based on our findings, a 34 mL reduction in the low-to-moderate infarct range roughly corresponds to a 10% increase in the probability of mRS 0-2. Depending on the imaging parameters, the measurement error on diffusion-weighted MRI, which is considered the gold standard for infarct volume assessment, may be as high as 15 mL [11], and measurement error on CT is even greater [12]. Therefore, it is unlikely that we will be able to reliably detect changes in infarct volume in the range of 1-5 mL, which would still translate to mRS changes that patients consider to be meaningful [7-9].
There are several new pharmacological stroke treatments under investigation, all of which tackle different tissue damage mechanisms. Their effects may be reflected by different imaging markers: for example, drugs preventing primarily neuronal damage would be expected to reduce grey matter infarct volume more than white matter infarct volume, and drugs stabilizing the blood-brain barrier should reduce parenchymal hemorrhage volume. We, therefore, assessed the association between adjusted probability of good outcome and other quantitative tissue imaging markers, namely grey matter infarct volume, white matter infarct volume, and parenchymal hemorrhage volume. The patterns we observed resembled the pattern of total infarct volume, with a linear-appearing association with good outcome probability at small to moderate volumes, and near-zero probability of good outcome at large volumes. We further observed a steeper decrease in good outcome probability per mL white matter infarct volume increase compared to grey matter infarct volume, which confirms that white matter damage may be more detrimental than grey matter damage [4]. However, these observations were subject to substantial uncertainty due to the small number of patients with grey and white matter infarct segmentations, hindering reliable outcome prediction based on affected brain tissue type. Adding complementary biomarkers such as serum neurofilament to imaging biomarkers could be a promising approach to improve outcome prediction accuracy further [13].
Our study has several limitations. First, infarct volumes were measured at 24 hours; however, it is known that infarcts continue to enlarge beyond 24 hours [14]. Our infarct volume measurements may therefore not accurately reflect final infarct volume. Second, manual infarct volume measurements are subject to inter-and intra-reader variability and measurement error due to partial volume averaging [11,15]. Third, the number of patients with available grey and white matter infarct volumes and parenchymal hemorrhage volumes was small. Fourth, besides infarct volume, infarct location is another important determinant of clinical outcome [4,16], which was not taken into account in our analysis because accurate determination of infarct location on NCCT is challenging, and since the ESCAPE-NA1 trial only included anterior circulation large vessel occlusion, which homogenized infarct location at least to some degree. Fifth, the ESCAPE-NA1 trial sample is a highly selective and homogenous patient sample, and our results may have looked different, had a broader and more diverse patient population been included.
Conclusions
In conclusion, we observed a near-linear association between total infarct volume and adjusted probability of achieving good outcome in patients with infarcts up to 250 mL, while the probability in patients with larger infarcts was near zero. In the former subgroup, a decrease in infarct volume of approximately 3.4 mL, 17 mL, and 34 mL was roughly associated with a 1%, 5%, and 10% increase in the probability of achieving a good outcome respectively, although there is some uncertainty surrounding these estimates.