Precision Greenness and Stroke/Transient Ischemic Attack in 249,405 US Medicare Beneficiaries
Article information

Dear Sir:
Stroke is the fifth leading cause of death in the United States and the second leading cause of death globally, which significantly impacts on quality of life and the ability to live independently [1]. There are well-established guidelines for preventing cardiovascular disease and stroke—based on behavioral factors of physical activity, diet, non-smoking, and maintaining a healthy weight; and biomedical parameters of blood pressure, blood glucose, and cholesterol. However, there is an increasing awareness that environmental factors may also be important contextual factors for preventing stroke and its sequelae.
An emerging protective factor for chronic disease is neighborhood greenness or vegetative presence, which has been linked to multiple health outcomes including cardiovascular disease [2] and stroke [3]. Greenness, including tree canopy and green spaces, may benefit cardiovascular health through multiple mechanisms, including physical activity, social interaction, improved air quality, heat regulation, and restoration from mental fatigue or stress [4]. The current study examines whether precision greenness at the micro-environmental level, defined as greenness measured at the census block by the Normalized Difference Vegetation Index (NDVI) from satellite imagery [5,6], is related to stroke and transient ischemic attack (stroke/TIA) [7]. We use the term “precision greenness” to denote that greenness is measured at the micro-environmental level, the census block. This is a much smaller geographic unit than has been used in prior research [8]. Using a relatively small geographic area as a unit of analysis for greenness is novel and has advantages over larger geographic areas. Important among these is that a unit of analysis as small as a census block informs possible mediators of the relationship between greenness and stroke. Another important reason is that it is more cost-effective for governments to target smaller geographic areas when planting because at-risk blocks can be targeted for tree planting.
A cross-sectional study in Miami-Dade County, FL, USA, was conducted to examine the relationship of greenness (mean NDVI) at the level of the census block (hereafter, the block) to odds of stroke/TIA among US Medicare beneficiaries aged ≥65 years whose location was unchanged from 2010 to 2011 [9]. The methods of the study are described elsewhere [2]. Data for this retrospective cohort study were obtained from the US Centers for Medicare and Medicaid Services (CMS)’ Master Beneficiary Summary File, which provided annual data for each beneficiary on stroke/TIA, age, sex, race/ethnicity, and location for calendar years 2010 and 2011 (Supplementary Figure 1) [7]. This study was approved by the University of Miami’s Human Subjects Research Office (FWA00002247, ePROST Protocol #20110948) and the US Centers for Medicare and Medicaid Services’ (CMS’) Data Privacy Board (CMS DUA# RSCH-2013-24971). Stroke/TIA was defined using CMS’ Chronic Conditions Warehouse algorithm for stroke/TIA, which assesses the presence/absence of stroke/TIA using the International Classification of Diseases, Ninth Revision (ICD-9) codes for that beneficiary within the previous year (for specific codes) (Supplementary Table 1) [7]. US National Aeronautics and Space Administration (NASA) Advanced Spaceborne Thermal Emission and Reflection Radiometer (ASTER) satellite imagery at 15 m×15 m spatial resolution was employed to assess greenness or vegetative presence by NDVI, a well-established measure of greenness [10]. Mean NDVI was computed at the block level for 2011, with higher values indicating more greenness, over a range from -1 to +1 [9,10]. For analytic purposes, NDVI was categorized into tertiles [9].
Descriptive (Table 1) and multilevel analyses (Table 2) were conducted using SAS, version 9.3 (SAS Institute, Cary, NC, USA). Multilevel logistics regression analyses were conducted with tertile of greenness as predictor (with the lowest greenness tertile as reference), and dichotomous variable presence/absence of stroke/TIA in 2011 as the outcome. Generalized estimating equation models with the assumption of compound symmetric working correlation structure were employed to specify the hierarchical models. Neighborhood median household income was included in the model at the block-group level (the smallest geographic scale for which this information is available); mean NDVI tertile was included at the block level (i.e., for a single block, nested within the block-group level); and age, sex, race, and ethnicity at the individual level (i.e., nested within block). To investigate whether block-level greenness is related to stroke/TIA, two multilevel logistics regression analyses/models were conducted, adjusting for potential explanatory factors. Model 1, the main model, adjusted for individual-level sociodemographics (age, sex, and race/ethnicity) and neighborhood median household income at the block-group level. Post-hoc Model 2 additionally adjusted for cardiometabolic risk factors (diabetes, hypertension, and hyperlipidemia) at the individual level.
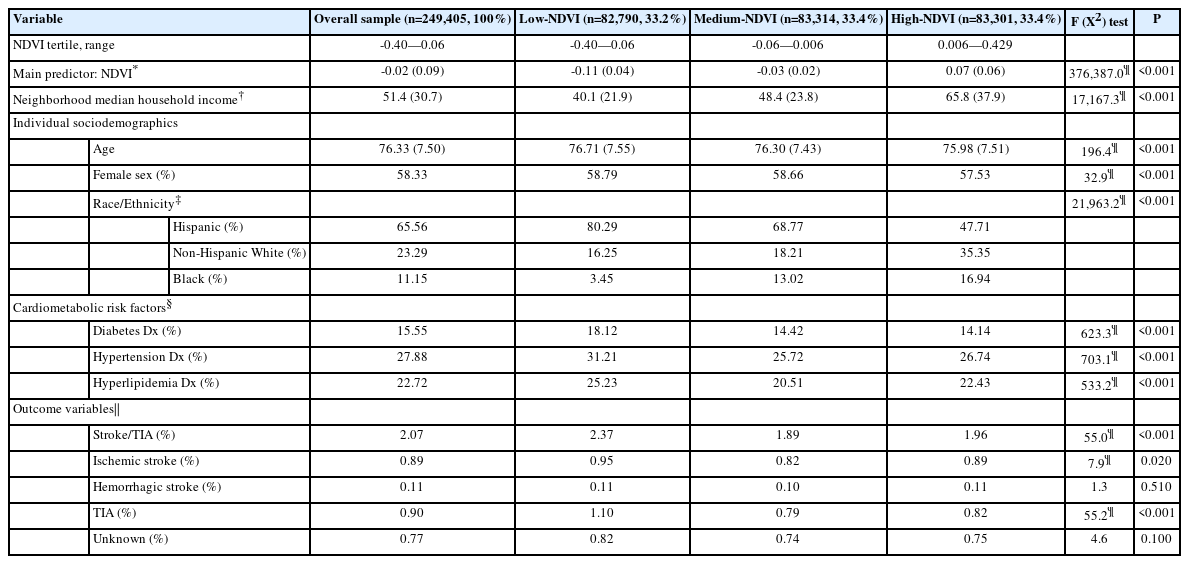
Descriptive statistics for the overall sample, and by neighborhood greenness level (i.e., lowest, middle, and highest tertiles on block-level NDVI)
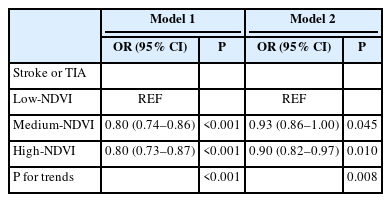
NDVI relationships to stroke/TIA in models adjusting for individual sociodemographics, neighborhood income, and/or cardiometabolic risk factors
In the main model (Model 1) when compared to the lowest tertile of greenness, the middle (odds ratio [OR]=0.80; 95% confidence interval [CI]: 0.74, 0.86, P<0.001) and highest (OR=0.80; 95% CI: 0.73, 0.87, P<0.001) greenness tertiles were each associated with a 20% lower odds of stroke/TIA. In Model 2, which tested for the potential attenuation of greenness’ impact on stroke/TIA by additionally adjusting for cardiometabolic risk factors, the middle (OR=0.93, 95% CI: 0.86, 1.00; P=0.045) and the highest (OR=0.90, 95% CI: 0.82, 0.97, P=0.010) greenness tertiles were associated with reduced odds of stroke/TIA. However, in Model 2, the magnitude of this association was attenuated when compared to the main model (Model 1). For more granular analysis of specific stroke types, please see Supplementary Table 2.
The current study adds to the greenness and health literature by suggesting that greenness or vegetative presence measured at the block level may be associated with reduced population-level risk for stroke/TIA, adding precision to our understanding of this relationship and the potential mechanisms (e.g., social interaction, physical activity within the block, pollution, and stress mitigation) by which greenness may have its impact on stroke/TIA. In post-hoc analyses adjusting for three common cardiometabolic conditions—diabetes, hypertension, and hyperlipidemia—the associations of greenness to stroke/TIA were attenuated by approximately 50%. Major limitations of this study include the cross-sectional nature which does not allow for causal conclusions, and not having physical activity information. That said, higher levels of precision greenness (NDVI at a rather precise geographic area, the elder’s block) were associated with reduced overall odds of stroke/TIA. These relationships were obtained in a population-based sample of 249,405 Medicare beneficiaries ages ≥65. Future research should determine whether environmental interventions such as increasing greenness at the block level can lower risk for stroke/TIA at the population level.
Supplementary materials
Supplementary materials related to this article can be found online at https://doi.org/10.5853/jos.2022.02922.
Stroke/transient ischemic attack categorization
NDVI Relationships to stroke/TIA, ischemic stroke, hemorrhagic stroke, TIA, and unknown stroke in unadjusted models and in adjusted models adjusting for individual sociodemographics, neighborhood income, and/or cardiometabolic risk factors
Flow diagram of final cohort. The overall cohort of all Miami-Dade County (MDC) Medicare beneficiaries, over 65 years of age, alive and residing on a census block with an MDC 9-digit zip code from 2010–2011, and identifying as an ethnic group >1% of MDC, without end stage renal disease, and not a resident of a nursing home. NDVI, Normalized Difference Vegetation Index. Adapted from Brown et al. Am J Prev Med 2016;51:78-89, with permission of Elsevier [9].
Notes
Disclosure
The authors have no financial conflicts of interest.
Acknowledgements
Portions of these findings were presented at Active Living Conference, in Orlando FL, on February 2nd, 2020; and American Heart Association’s International Stroke Conference, virtually, on March 17th, 2021.
This project was supported in part by grants from the U.S. Department of Housing & Urban Development (Grant# HUD H-27620-RG; Contact PI: Brown), the Health Foundation of South Florida (PI: Brown); the U.S. National Heart, Lung & Blood Institute/National Institutes of Health (NIH) (Grant# R01HL148880, PIs: Brown and Szapocznik; 3R01HL148880-03S1, Diversity Supplement: W. Aitken); the U.S. National Institute on Aging/NIH (Grant# 1RF1AG074306; PIs: Brown, Szapocznik and Rundek); by the Parks Foundation of Miami-Dade, and by the Evelyn F. McKnight Brain Institute at the University of Miami.