Dual-Energy Computed Tomography Quantification of Extravasated Iodine and Hemorrhagic Transformation after Thrombectomy
Article information

Dear Sir:
After endovascular thrombectomy (EVT) for ischemic stroke, early prediction of hemorrhagic transformation (HT) is important because HT often requires changes in therapeutic strategy [1]. Parenchymal hyperdense lesions, commonly observed on brain computed tomography scans after EVT, are caused by ischemic disruption of the blood-brain barrier and may be seen with secondary contrast staining or hemorrhage [2-4]. Dual-energy computed tomography (DECT) can accurately differentiate hemorrhage from contrast staining, and parenchymal contrast staining has been associated with the development of future HT [2-4]. However, whether the predictability may be improved when both imaging and clinical markers are simultaneously considered and the imaging marker associated with HT volume remain unclear.
Hence, we aimed to identify quantified markers for iodine extravasation on early DECT for the occurrence and volume of HT and investigate whether the simultaneous consideration of clinical markers could improve predictability.
This single-center retrospective study included patients with acute ischemic stroke with large artery occlusion of the anterior circulation, who underwent EVT and DECT within 60 minutes after EVT between May 2019 and October 2020 (Supplementary Figure 1). The details of the study design and imaging analysis are described in the Supplementary methods and Supplementary results [3-18]. Briefly, the volume of interest (VOI) was manually drawn by two independent readers. The VOIs covered all areas of increased iodine concentration within the corresponding infarct territory on the iodine map of DECT. Iodine concentrations were then extracted from the VOIs of all images, and quantitative parameters were calculated (Figure 1). We determined the maximum iodine concentration and iodine extravasation volume that best predicted the occurrence and volume of HT, respectively (Supplementary Tables 1 and 2). HT was diagnosed and measured for volume with T2*-weighted gradient echo (GRE) sequences 24 hours after EVT.
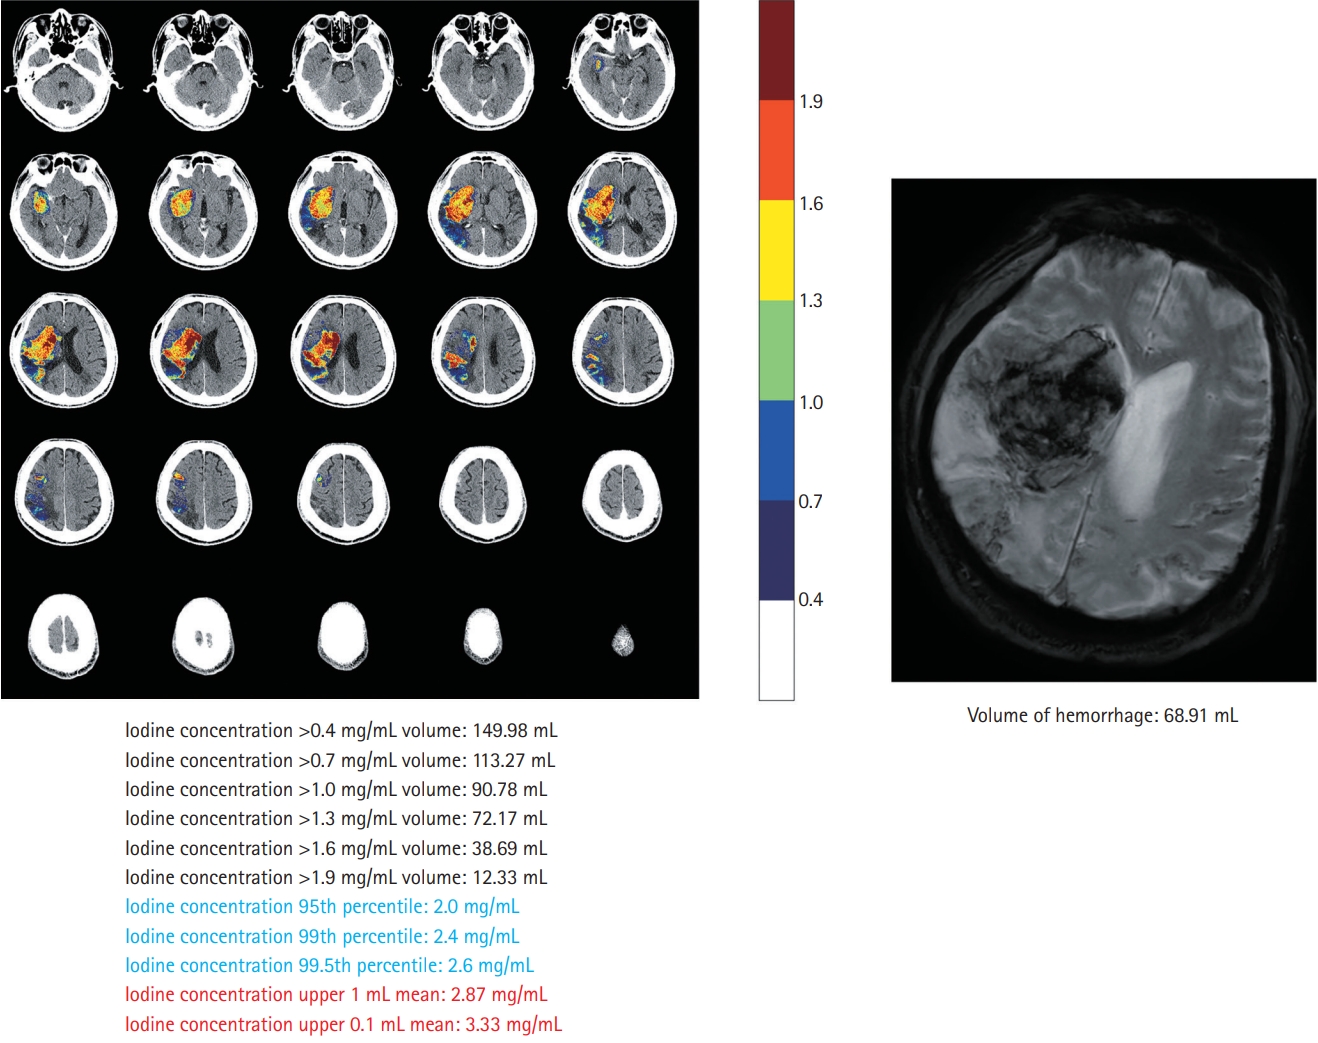
Iodine extravasation markers on dual-energy computed tomography and comparison with gradient echo imaging.
Of the 56 included patients, 28 (50.0%) had HT and nine (16.1%) had parenchymal hemorrhage (Supplementary Table 3). The mean HT volume on GRE was 6.3 mL (range, 0.0 to 89.6). After adjustment for clinical variables (Supplementary Table 4), the maximum iodine concentration, defined as the iodine concentration at the 95th percentile, was the best predictor of HT occurrence (odds ratio, 8.29; 95% confidence interval, 2.30 to 29.93) (Table 1). Adding the clinical model, consisting of serum glucose level and collateral scores (Supplementary Table 4), to the maximum iodine concentration improved the prediction of HT occurrence, as measured using the area under the receiver operating curve (0.834 to 0.931, P=0.044) (Supplementary Figure 2). The iodine extravasation volume, defined as the volume of iodine concentration >0.7 mg/mL, showed the best correlation with HT volume (β=0.44, R2 =0.791, P<0.001, Table 1; Pearson’s partial correlation coefficient r=0.823, P<0.001, Supplementary Figure 3).

Multivariable regression analysis of the iodine extravasation markers
Herein, the maximum iodine concentration on DECT immediately after EVT was associated with HT occurrence. This finding is consistent with those of previous studies, where the maximum iodine concentration was determined in the manually defined hotspot ROI in the selected area [3,4]. Using a VOI-based histogram approach, we could further reduce the potential risks of selection bias and determine the better imaging marker of iodine extravasation [19]. The clinical outcomes after an EVT may be directly associated with the HT volume or parenchymal hemorrhage rather than the presence of HT itself [20]. We found an independent linear correlation between the iodine extravasation volume on DECT and HT on GRE. Moreover, the prediction of HT improved when clinical variables were considered along with the imaging findings. Thus, it is necessary to consider both clinical factors and imaging markers when predicting HT. This study had some limitations. The sample size is small and most of the HTs in our study population had a small volume, which might limit its clinical impact.
In conclusion, the quantitative assessment of iodine extravasation on DECT immediately after EVT could help identify patients with a higher risk of HT development and a larger HT volume. Additionally, it would be beneficial to consider both clinical factors and imaging markers to predict HT.
Supplementary materials
Supplementary materials related to this article can be found online at https://doi.org/10.5853/jos.2021.03391.
AUC comparison for occurrence of hemorrhagic transformation
Correlation coefficient comparison for volume of hemorrhagic transformation
Demographic characteristics of patients stratified by hemorrhagic transformation
Univariable regression analysis
Patient selection. DECT, dual-energy computed tomography; EVT, endovascular thrombectomy; COVID-19, coronavirus disease 2019; MRI, magnetic resonance imaging; SAH, subarachnoid hemorrhage.
Additive predictive value of maximum iodine concentration on dual-energy computed tomography after endovascular thrombectomy for ischemic stroke measured by comparison of area under curve (AUC). We evaluated whether hemorrhagic transformation (HT) prediction was improved by adding a clinical model consisting of serum glucose levels and collateral scores to the maximum iodine concentration. The AUC for HT occurrence was 0.800 (95% confidence interval [CI], 0.687 to 0.914) for the clinical model and 0.834 (95% CI, 0.726 to 0.943) for the maximum iodine concentration alone. When both the clinical model and maximum iodine concentration were considered, the AUC increased to 0.931 (95% CI, 0.867 to 0.995; P=0.044), with 85.7% sensitivity and 92.9% specificity.
Relationship between volume of hemorrhagic transformation and volume of iodine extravasation on dual-energy computed tomography after endovascular thrombectomy for ischemic stroke measured by Pearson’s partial correlation coefficient after adjusting for clinical variables. The volume of iodine extravasation showed a significant correlation with the hemorrhagic transformation (HT) volume after adjusting for clinical variables; diabetes, prothrombin time, National Institutes of Health Stroke Scale (NIHSS), Alberta Stroke Program Early CT Score (ASPECTS) (partial r=0.823, P<0.001). However, the maximum iodine concentration was not correlated (Pearson’s partial correlation coefficient r=0.260, P=0.063) with the HT volume. The y-axes are based on the calculated residuals from regressing hemorrhage volume on diabetes, prothrombin time, NIHSS, and ASPECTS. The x-axes are based on the calculated residuals from the regressing volume of iodine extravasation on diabetes, prothrombin time, NIHSS, and ASPECTS. r, Pearson’s partial correlation coefficient (r=0, no linear relationship; r=1 or −1, perfect linear relationship).
Notes
Disclosure
The authors have no financial conflicts of interest.