Pupillometer-Based Neurological Pupil Index Differential: A Potential Predictor of Post-Stroke Delirium
Article information

Dear Sir:
Delirium is a common complication of stroke [1]. The Intensive Care Delirium Screening Checklist (ICDSC) is used to screen patients with stroke [2]; however, relying solely on the ICDSC can be challenging when patients experience communication difficulties owing to stroke-related disorientation, aphasia, and dysarthria [3]. Furthermore, despite the strong association between cognitive function and delirium occurrence, detailed neurological examinations require professional skills, which may be difficult to perform [2]. Therefore, a simple and rapid method that is independent of cognitive function to predict delirium is needed.
NeurOptics® NPi®-200 (Neuroptics Inc., Irvine, CA, USA) is an automated pupillometer that can be used to assess and measure various pupillary light reflex parameters [4]. Using a proprietary mathematical algorithm, the NPi®-200 pupillometer calculates the neurological pupil index (NPI), which is a quantitative measure indicating the pupillary response to light stimulation [5]. Specifically, an NPI <3 and an NPI differential >0.7 between the left and right pupils have been found to be independent predictors of unfavorable outcomes in neurologically injured patients, including those with stroke [6]. However, studies on pupillometry usage to predict post-stroke delirium are limited. Herein, we aimed to fill this research gap and develop a simple and rapid method for predicting delirium in such patients.
In this retrospective, single-center, observational study, the inclusion criteria were: successful pupil evaluation on admission using an NPi®-200 pupillometer, diagnosis of ischemic stroke or intracerebral hemorrhage, and admission to the special care unit (SCU) of the National Cerebral and Cardiovascular Center, Suita, Japan. This study was approved by the ethics committee of the National Cerebral and Cardiovascular Center (study name: The Utility of Pupillometry in Acute Stroke Management, approved date: 28th December 2022, approval number: R22041). All procedures were followed in accordance with the institutional review board’s ethical standards and with the Helsinki Declaration of 1975. The detailed information is described in the Supplementary Methods.
Table 1 summarizes the demographic and clinical characteristics of the study population stratified by the absence or presence of delirium. After participant selection, 131 patients with successful pupil evaluations were eligible for our analysis (Supplementary Figure 1). The mean age was 73.4±12.0 years, and 80 patients (61.1%) were male (Table 1). The prevalence of dementia was higher in the delirium group (16.0%) than in the non-delirium group (3.8%). Twenty-five patients (19.1%) developed delirium after stroke during their SCU stay. Patients with delirium had significantly higher National Institutes of Health Stroke Scale (NIHSS) scores (2 [1–5] vs. 19 [9–25], P<0.01) and lower Glasgow Coma Scale (GCS) scores (15 [15–15] vs. 12 [10–14], P<0.01) than patients without delirium. This implies that patients with more severe stroke symptoms, as measured using the NIHSS, and those with lower GCS scores are at a significantly higher risk of developing delirium.
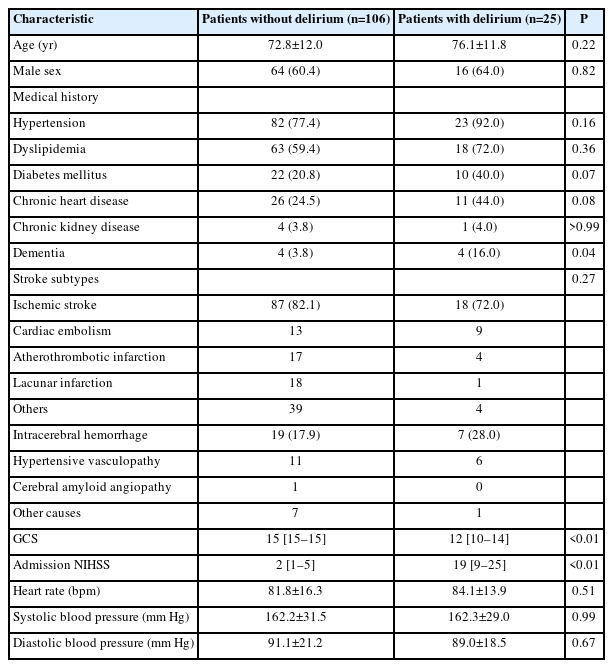
Summary of patient demographics and baseline characteristics
This study compared various pupil sizes and NPI parameters in patients with versus without delirium (Table 2). There was a trend toward a higher prevalence of patients with minimum NPI <3 in the delirium group than in the non-delirium group (5/106 [4.7%] vs. 4/25 [16.0%], P=0.07). The NPI differential was significantly higher in patients with delirium than in those without delirium (0.21±0.45 vs. 0.72±1.06, P<0.01), with a higher frequency of patients having an NPI differential >0.7 in the delirium group than in the non-delirium group (6/106 [5.7%] vs. 7/25 [28.0%], P<0.01). Moreover, we identified 28 patients with ischemic stroke or hemorrhage in the brainstem and cerebellum. We did not find significant association between brainstem and cerebellar damage and the abnormal NPI findings (minimum NPI <3, 5/103 [4.9%] vs. 4/28 [14.3%], P=0.08; NPI differential >0.7, 9/103 [8.7%] vs. 4/28 [14.3%], P=0.38; delirium, 21/103 [20.4%] vs. 4/28 [14.3%], P=0.47). In a multivariable logistic regression analysis, an NPI differential >0.7 emerged as an independent predictor of delirium (adjusted odds ratio 6.2, 95% confidence interval 1.46–26.35, P=0.01), while a minimum NPI <3 and pupil size did not provide significant predictive values (Figure 1). Among other parameters, the differential of maximum constriction velocity, latency of constriction, and pupil size at peak were significantly different between the groups. However, multivariable logistic regression analysis revealed no significant association between these parameters and delirium (Supplementary Tables 1 and 2).
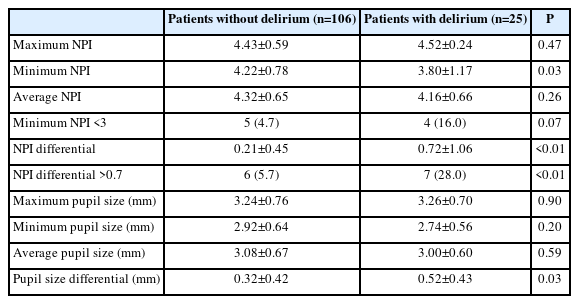
Comparison of NPI between patients with and without delirium
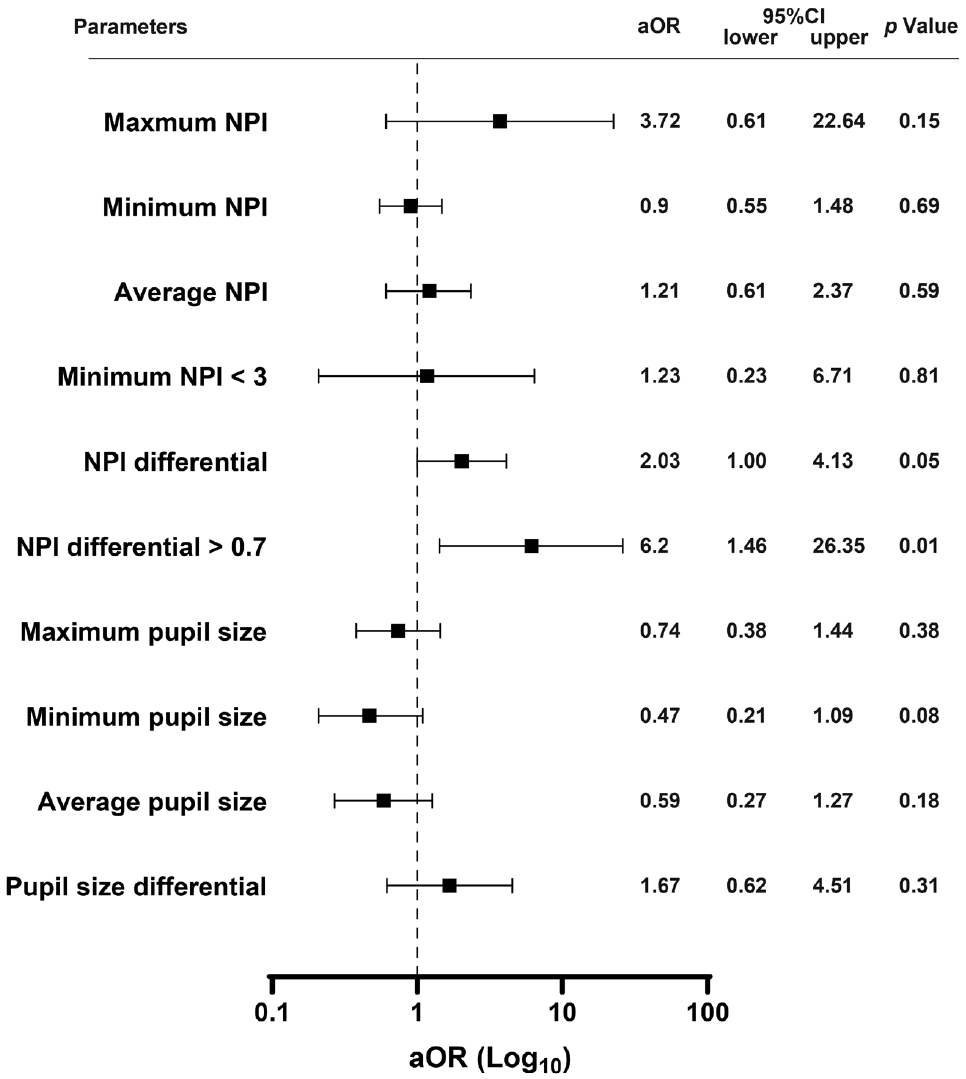
Multiple logistic regression analysis for predicting post-stroke delirium. Forest plot for delirium prediction. The multiple logistic regression analysis for delirium prediction was adjusted for age, sex, dementia, and the Glasgow Coma Scale score. aOR, adjusted odds ratio; CI, confidence interval; NPI, neurological pupil index.
Our findings indicate the effectiveness of the NPi®-200 pupillometer for predicting delirium in patients with stroke. Notably, the prediction model based on NPi®-200 pupillometry is independent of the presence of dementia, which is a major risk factor for delirium. Additionally, our evaluation using the NPi®- 200 pupillometer was performed at the emergency department, ensuring that our results were not influenced by subsequent treatments or adverse events that could potentially lead to delirium during hospitalization. This quantitative model has considerable potential for post-stroke delirium prediction.
The role of the ascending reticular activating system (ARAS), a neural network connecting brainstem source nuclei to various brain regions, has been implicated in the development of delirium [7]. Additionally, the autonomic nervous system (ANS) influences neurotransmitters that are crucial for ARAS function [8,9]. In patients with stroke, disruptions in ARAS connectivity, coupled with ANS disturbances, can contribute to the development of delirium. Furthermore, abnormal connectivity in the arousal and attention networks of the unaffected hemisphere has been associated with relatively severe delirium [10]. Therefore, the NPI laterality could explain the differences observed in the light reflexes of the right and left pupils. Additionally, our study indicates that other single parameters could not elucidate this complicated process, except NPI which is calculated by combining multiple parameters concerning pupil reaction. The absence of delirium in patients with an NPI <3 may be due to severe ARAS disruption, which precludes the typical presentation of delirium.
Our study has some limitations. First, we did not investigate medication information, such as opioids, anticholinergic agents, cholinergic agents, or autonomic agents, upon admission, which could have affected the pupillary findings. Second, the algorithm used to calculate the NPI has not been publicly disclosed, thereby preventing us from fully understanding how stroke alters the NPI. Nonetheless, the NPI is based on the pupillary light reflex, and the disruption of this reflex due to stroke may play a crucial role in the observed changes.
In conclusion, our study revealed a significant association between an NPI differential >0.7 and post-stroke delirium. Notably, this biomarker was independent of dementia, indicating that pupillometry is a valuable and efficient approach for predicting delirium. Its simplicity and speed make it an effective approach for post-stroke delirium prediction.
Supplementary materials
Supplementary materials related to this article can be found online at https://doi.org/10.5853/jos.2023.04406.
Comparison of pupillary findings between patients with and without delirium
Multiple logistic regression analysis for predicting post-stroke delirium
Flowchart. Between April 2022 and October 2022, 504 patients with suspected stroke were admitted to our hospital and underwent NPi®-200 pupillometry testing, and 207 patients were admitted to the stroke care unit. Among them, 39 patients who underwent NPi®-200 pupillometry less than three times for each eye were excluded. After excluding 22 patients without stroke, 131 patients with successful pupil evaluations were analyzed.
Notes
Funding statement
None
Conflicts of interest
The authors have no financial conflicts of interest.
Author contribution
Conceptualization: KT, TT, MI. Study design: KT, TT, KW, MI. Methodology: KT, TT, KK, MI. Data collection: KN, SA, RU, MM, YA, HK, RI. Investigation: KT, SA, RU. Statistical analysis: KN, TT. Writing—original draft: KN, TT. Writing—review & editing: SA, KW, SMMB, MK, KT, MI. Approval of final manuscript: all authors.
Acknowledgements
We would like to thank Editage (www.editage.com) for the English language editing.