Infarcts Due to Large Vessel Occlusions Continue to Grow Despite Near-Complete Reperfusion After Endovascular Treatment
Article information
 , Ryan McTaggart3
Abstract
Background and Purpose
Infarcts in acute ischemic stroke (AIS) patients may continue to grow even after reperfusion, due to mechanisms such as microvascular obstruction and reperfusion injury. We investigated whether and how much infarcts grow in AIS patients after near-complete (expanded Thrombolysis in Cerebral Infarction [eTICI] 2c/3) reperfusion following endovascular treatment (EVT), and to assess the association of post-reperfusion infarct growth with clinical outcomes.
Methods
Data are from a single-center retrospective observational cohort study that included AIS patients undergoing EVT with near-complete reperfusion who received diffusion-weighted magnetic resonance imaging (MRI) within 2 hours post-EVT and 24 hours after EVT. Association of infarct growth between 2 and 24 hours post-EVT and 24-hour National Institutes of Health Stroke Scale (NIHSS) as well as 90-day modified Rankin Scale score was assessed using multivariable logistic regression.
Results
Ninety-four of 155 (60.6%) patients achieved eTICI 2c/3 and were included in the analysis. Eighty of these 94 (85.1%) patients showed infarct growth between 2 and 24 hours post-reperfusion. Infarct growth ≥5 mL was seen in 39/94 (41.5%) patients, and infarct growth ≥10 mL was seen in 20/94 (21.3%) patients. Median infarct growth between 2 and 24 hours post-reperfusion was 4.5 mL (interquartile range: 0.4–9.2 mL). Post-reperfusion infarct growth was associated with the 24-hour NIHSS in multivariable analysis (odds ratio: 1.16 [95% confidence interval 1.09–1.24], P<0.01).
Conclusion
Infarcts continue to grow after EVT, even if near-complete reperfusion is achieved. Investigating the underlying mechanisms may inform future therapeutic approaches for mitigating the process and help improve patient outcome.
Introduction
Acute ischemic stroke (AIS) is often caused by a blood clot blocking arterial blood supply to the brain parenchyma. The larger the occluded vessel, the larger resulting infarct and the poorer the outcomes [1,2]. Therefore, AIS due to large vessel occlusion (LVO) is one of the most devastating forms of AIS [3]. The only curative treatment for LVO-AIS is restoration of blood flow in the occluded vessel, which recovers blood supply to the brain parenchyma. This can be achieved either by dissolving the clot with intravenous thrombolytics, or endovascular clot removal (endovascular treatment [EVT]) [4]. Quality of reperfusion in the middle cerebral artery territory following EVT is measured with the expanded Thrombolysis in Cerebral Infarction (eTICI) scale. Near-complete reperfusion (eTICI 2c/3, i.e., >90% vessel opacification in the affected territory, is the goal when performing EVT [5]).
Some studies suggest that achieving eTICI 2c/3 reperfusion stops ischemic tissue damage, and thus, no infarct growth should occur after reperfusion has been achieved [6]. On the other hand, data suggest that infarcts continue to grow even after reperfusion [7]. One major caveat with many studies that sought to assess post-reperfusion infarct growth is that infarct volume was assessed before and after EVT, rather than early and late after EVT [8]. In such a setup, some or all of the observed infarct growth may have occurred prior to reperfusion, and it is impossible to determine the true proportion of infarct growth that has occurred after EVT. Only a few, relatively small studies truly investigated infarct growth after EVT [9].
We used data from a retrospective single-center study in which AIS-LVO patients undergoing EVT received magnetic resonance imaging (MRI) within 2 hours post-EVT, as well as 24 hours after EVT, to investigate whether and how much infarcts grow after near-complete (eTICI 2c/3) reperfusion. We hypothesize that infarct volume will be higher for eTICI 2c compared to eTICI 3. In addition, we further assessed the association between infarct growth on clinical measures (24-hour National Institutes of Health Stroke Scale [NIHSS] and 90-day modified Rankin Scale score [mRS]), hypothesizing that more growth will be associated with worse outcomes.
Methods
Patient sample
We used data from a single-center retrospective observational cohort study that included consecutive adult patients presenting with AIS due to LVO who underwent EVT and received MRI at two time points after EVT. Four authors (GB, NR, RMcT, JO) analyzed and controlled the study data. The first MRI was obtained within 2 hours post-EVT and the second MRI was obtained 24 hours after EVT. Patients arriving at the emergency department between September 2020 and November 2021 were included. Inclusion criteria were AIS patients with occlusion of the intracranial internal carotid artery, M1 or M2 segment of the middle cerebral artery undergoing EVT, age >18, and ability to undergo MRI post-EVT (i.e., absence of MRI contraindications). This study was conducted in accordance with HIPPA (Health Insurance Portability and Accountability Act) and the use of data for this study was approved by our hospital’s Institutional Review Board (1741057-13). Due to its observational nature, the requirement for informed consent was waived. To eliminate the possibility of infarct growth post-EVT due to incomplete reperfusion/ongoing ischemia, we included only patients in whom near-complete recanalization (eTICI 2c/3) was achieved during EVT.
Data collection
Data were collected from electronic medical records and stored prospectively in a REDCap (Research Electronic Data Capture; Vanderbilt University, Nashville, TN, USA) database [10,11]. REDCap is a secure, web-based software platform designed to support data capture for research studies. We collected data on patient demographics, comorbidities, and clinical and radiological characteristics.
Imaging acquisition
Baseline imaging
Baseline imaging consisted of a non-contrast computed tomography (NCCT) head (120 kV, 50–120 mA, 20 mm beam collimation, average dose length product [DLP] 850 mGy∙cm) and a multiphase computer tomography angiography (CTA), consisting of an arterial phase from aortic arch to vertex, a peak-venous and late-venous phase with skull-base to vertex coverage (120 kV, 100–450 mA, 40-mm beam collimation, average dose length product 175 mGy∙cm) after injection of 80 mL Iohexol.
NCCT was reconstructed in 5-mm slice thickness in axial, coronal, and sagittal reformations in respect to the glabello-meatal plane. Multiphase CTA were reconstructed in 1-mm multiplanar reformations as well as maximum-intensity projections. Acquisition mode was helical.
Digital subtraction angiography
Digital subtraction angiography was performed on a Siemens ARTIS icono biplane machine (Siemens Healthineers, Erlangen, Germany). After the EVT attempt was performed, anterior-posterior and lateral angiograms of the intracranial vasculature of the affected hemisphere were obtained to allow for accurate assessment of eTICI.
Post-EVT MRI
Two MRI scans were obtained following EVT: the first MRI was obtained within 2 hours post-EVT and the second MRI was obtained 24 hours after EVT. Each MRI consisted of T1-weighted (T1W), T2-weighted fluid-attenuated inversion recovery (T2W FLAIR), diffusion-weighted imaging (DWI), and apparent diffusion coefficient (ADC) sequences. Hemorrhage-sensitive sequences (gradient echo or susceptibility-weighted imaging) were available as well in most cases. DWI at both time points was acquired using a Siemens Magnetom Aera MRI (Siemens Healthineers, Erlangen, Germany), with a voxel size of 1.4×1.4×5.00 mm, repetition time of 6,800 ms, and an echo time of 104 ms.
Imaging analysis
Baseline imaging
Baseline NCCT and CTA were evaluated by an attending neuroradiologist (RM) with 17 years of stroke imaging experience, who assessed the Alberta Stroke Program Early CT Score (ASPECTS) on baseline CT and determined the occlusion location (terminal internal carotid artery vs. M1 segment vs. M2 segment of the middle cerebral artery). Furthermore, collateral status was scored as poor (<25% opacification of downstream vasculature compared to the contralateral side), moderate (25%–50% opacification of downstream vasculature compared to the contralateral side), or good (>50% opacification of downstream vasculature compared to the contralateral side) based on the multiphase CTA, as described in a previous trial [12].
Digital subtraction angiography
eTICI was assessed by an attending interventional neuroradiologist (RM) with 17 years of stroke imaging experience on the last intracranial digital subtraction angiography run. eTICI describes vascular opacification in the territory downstream to the initial vessel occlusion in a semi-quantitative fashion. An eTICI score of 2b or higher, that is, normal vascular opacification in 50%–90% of the downstream arterial territory, is considered “successful reperfusion,” eTICI 2c or higher (i.e., >90% opacification of vessels in the downstream arterial territory) is considered “nearcomplete reperfusion,” and eTICI 3 (100% normal opacification of vessels in the downstream arterial territory) is considered “complete reperfusion.” eTICI 2b or higher has traditionally been considered “successful reperfusion,” but it has become evident that outcomes are significantly improved with eTICI 2c/3 (i.e., >90% opacification of vessels in the downstream arterial territory) compared eTICI 2b [13].
Post-EVT MRI at 2 and 24 hours
T1W, T2W FLAIR, DWI, and ADC sequences for each patient were converted into Neuroimaging Informatics Technology Initiative format using dcm2niiX (www.mricro.com). Infarct segmentation was performed in a semi-automated fashion using a standard imaging library (www.nipy.org) in Python 3.10 (www.python.org). In the automated pre-segmentation, voxels in the infarcted hemisphere were included in the infarct segmentation volume if they exceeded the contralateral hemisphere’s mean intensity by two standard deviations. These automatically generated pre-segmentations were modified by a trained medical student (NR) and finalized by one of three attending neuroradiologists (JB with 21 years of stroke imaging experience, GJ with 8 years of stroke imaging experience, MDA with 2 years of stroke imaging experience) using the 3DSlicer software (version 4.11.2; Harvard University, Cambridge, MA, USA). Two-hour and 24-hour post-EVT imaging was hereby reviewed anonymously at independent time points, with at least 30 days between 2-hour and 24-hour post-EVT imaging review.
Interrater reliability of infarct volume measurements between the three experts was evaluated by using the intraclass correlation coefficient (ICC) assuming random effects in a randomly generated subset consisting of 10 cases, where the interrater variability among three radiologists was ICC >0.90 (manuscript under review). In addition to DWI, T1W, T2W FLAIR, and ADC sequences were available to assist in identification of potential artifacts and old, pre-existing infarcts. Both 2-hour and 24-hour post-EVT scans were assessed for presence of subarachnoid and intraparenchymal hemorrhage; the latter was classified according to the Heidelberg bleeding classification, as described previously [14,15]. Stroke lesions did not include hemorrhage volumes at either of the two imaging time points.
Outcomes of interest
The primary outcome was infarct growth, calculated by subtracting 2-hour infarct volume in a given patient from 24-hour infarct volume of the same patient. Secondary outcomes include the NIHSS at 24 hours and 90-day mRS.
Statistical analysis
Analyses were accomplished using SAS Software 9.4 (SAS Inc., Cary, NC, USA) and Stata Version 18 (StataCorp LLC, College Station, TX, USA). Differences in baseline characteristics between patients with and without infarct growth between 2 hours and 24 hours were compared using descriptive statistics, Fisher’s exact test, and Wilcoxon rank sum test. All modeling conducted using the GLIMMIX procedure with maximum likelihood estimation (Laplace). Change between 2-hour and 24-hour post-EVT infarct volumes was modeled using generalized linear mixed modeling (GLMM) with a negative binomial distribution and a log link function, where a patient’s baseline infarct was allowed to vary, assuming an unspecified covariance structure; this modeling was confirmed with non-parametric tests when possible, including the Friedman’s test and Van der Waerden two-sample test. Moderators of this change include eTICI score (2c vs. 3), examining both baseline and change between groups, along with age, sex, collateral score, alteplase administration, time between stroke onset and recanalization (or procedure end), intravascular stroke location (internal carotid artery, M1, M2), and time between groin puncture and recanalization. Interrater variability among three radiologists at with a random sample of cases was measured using the Shrout-Fleiss reliability coefficient assuming a random effect. Secondary outcomes were examined using GLMM (binomial/multinomial) and include change in mRS between pre-morbid and 90-days, as well as change in NIHSS between initial presentation and 24 hours later. The 90-day mRS was examined with absolute infarct growth and pre-stroke mRS using generalized linear modeling, where there was no evidence of a violation of the proportional odds assumption (P>0.50). Lastly, cubic spline regression was used to model the relationship between short-term clinical outcomes (24-h NIHSS) and infarct growth. Alpha was established a priori at the 0.05 level and all interval estimates were calculated for 95% confidence.
Results
Of 270 patients who underwent EVT during the period of the study, 151 had complete imaging of sufficient quality, 94 of which achieved an eTICI score of 2c/3 and were included in the current study (Figure 1). The median age of the sample was 74 (interquartile range [IQR] 64–86) and 45 (48%) were male. Patient baseline characteristics are shown in Table 1.
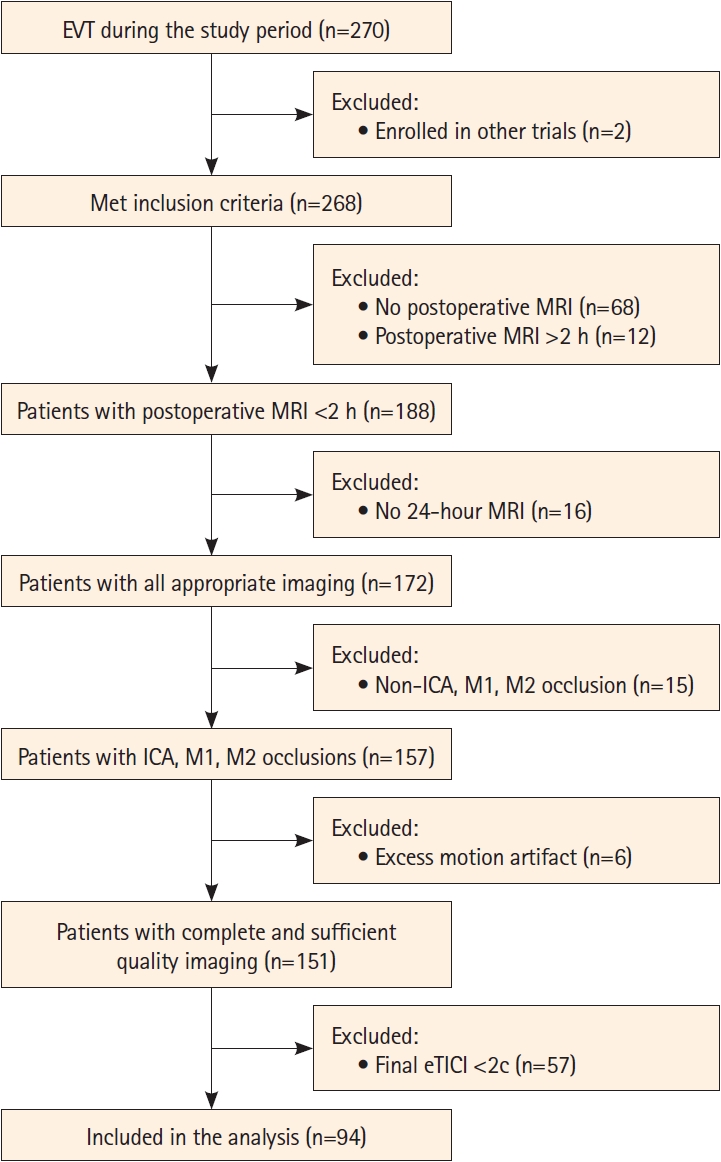
Flowchart with included and excluded patients. EVT, endovascular treatment; MRI, magnetic resonance imaging; ICA, internal carotid artery; eTICI, expanded Thrombolysis in Cerebral Infarction score.
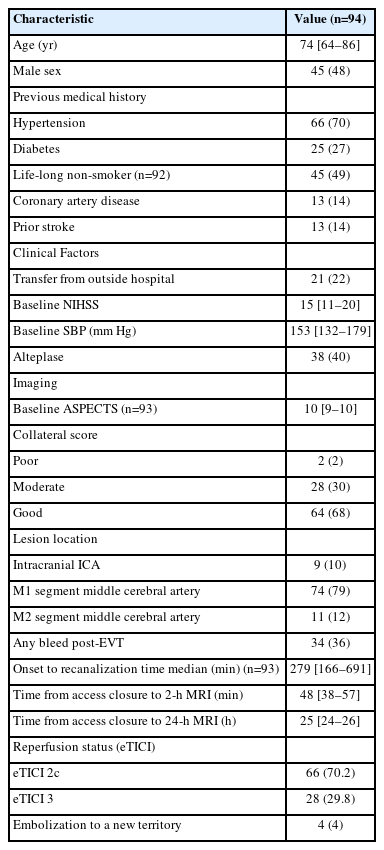
Baseline characteristics of the patient included in the study
Prevalence of post-EVT infarct growth
Of the 94 patients included in the study, 80 (85%) had infarct growth (59/66 [89.4%] with final eTICI 2c and 75.0% [21/28] with final eTICI 3), defined as a larger volume at 24 hours than at 2 hours (Figure 2). No significant differences in baseline or procedural variables were found between patients with and without post-EVT infarct growth (Supplementary Table 1). As illustrated in Figure 3, growth was modeled over time, where mean infarct volume was 8.5 mL (95% confidence interval [CI] 6.1–11.9) within 2 hours post-EVT and 13.1 mL (95% CI 9.5–18.1) at 24 hours; this relative change was statistically significant (∆ of logs=0.4284, 95% CI 0.2991–0.5578, P<0.01). These results were confirmed using Friedman’s test, where median post-EVT infarct volume was 10.0 mL (IQR 3.02–20.0) and increased to 14.4 mL (IQR 5.9–29.3) at 24 hours (P<0.01).
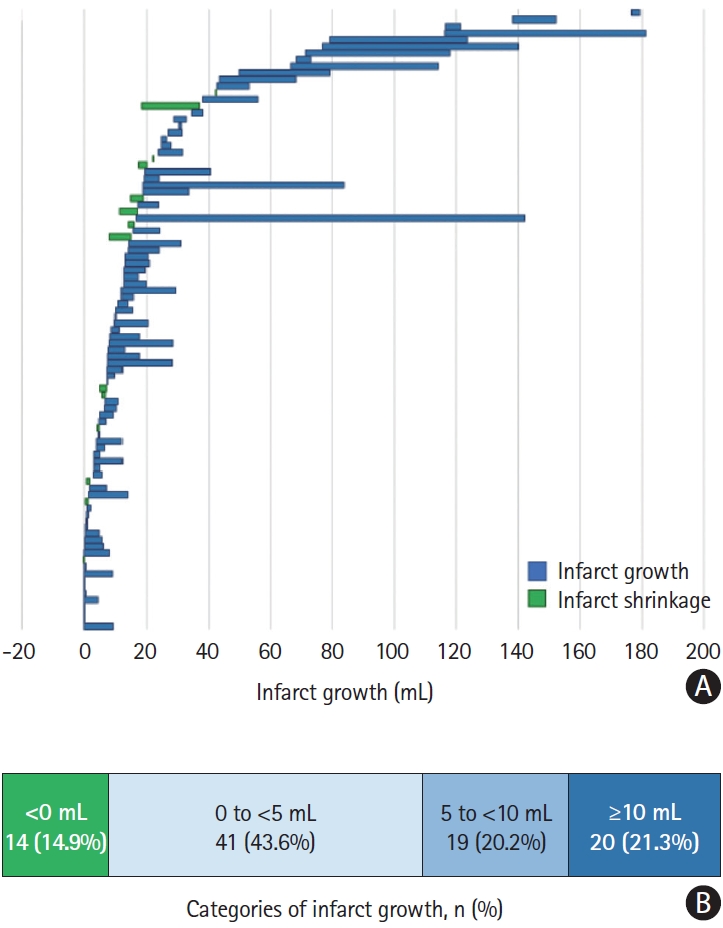
Infarct growth between 2 and 24 hours post-EVT in the 94 patients with eTICI 2c/3 that were included in the analysis. Waterfall chart in (A) shows infarct growth as bars, whereby the left end of the bar denotes the infarct volume 2 hours post-EVT, and the right end of the bar denotes the infarct volume 24 hours post-EVT. Blue bars indicate infarct growth between 2 and 24 hours, green bars indicate infarct shrinkage between 2 and 24 hours. (B) shows the number and percent of patients with infarct growth <0 mL (infarct shrinkage), infarct growth between 0 and <5 mL, between 5 and <10 mL, and ≥10 mL between 2 hours and 24 hours post-EVT. EVT, endovascular treatment; eTICI, expanded Thrombolysis in Cerebral Infarction score.
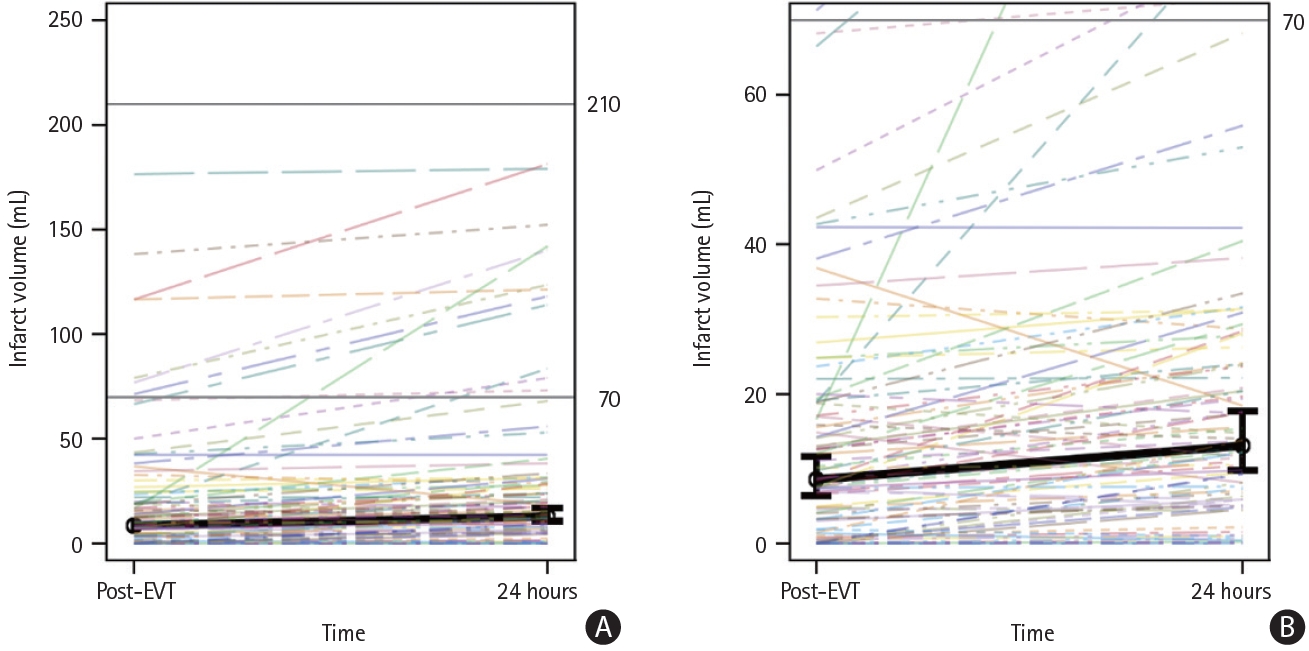
Infarct volume (DWI lesion volume) at the initial MRI (within 2 hours from EVT) and at 24 hours after EVT. The black line illustrates the change for all patients along with 95% confidence limits. The colored lines are individual patients, demonstrating the range of initial infarct volumes and their trajectory at 24 hours. (A) Infarct volumes ranging from 0 mL to 200 mL. (B) Infarct volumes ranging from 0 mL to 70 mL. DWI, diffusion-weighted imaging; MRI, magnetic resonance imaging; EVT, endovascular treatment.
This growth was then modeled stratified by post-EVT eTICI score. Mean post-EVT infarct volume was lower for eTICI 3 patients (5.62 mL, 95% CI 3.25–9.75) compared to eTICI 2c patients (10.25 mL, 95% CI 6.87–15.31; P=0.04); likewise, 24-hour infarct volume was lower for eTICI 3 patients (8.11 mL, 95% CI 5.04–13.05) compared to eTICI 2c patients (16.04 mL, 95% CI 10.89–23.64; P=0.01); these differences were confirmed using Van der Waerden two-sample test, where median post-EVT infarct volume for eTICI 3 was 8.13 mL (IQR 0.94–15.7) and 11.18 (IQR 3.98–30.26) for eTICI 2c (P=0.02); likewise, median 24-hour infarct volume for eTICI 3 was 11.83 mL (IQR 4.84–18.9) and 18.06 (IQR 6.32–40.49) for eTICI 2c (P=0.02).
Relative infarct growth (DWI lesion expansion) for eTICI 3 (∆=0.3659, 95% CI 0.1307–0.6011) and eTICI 2c (∆=0.4478, 95% CI 0.3033–0.5924) were not significantly different from each other (P=0.53). In other words, although differences in baseline infarct volume between eTICI groups translated into similar differences in infarct volume at 24 hours between eTICI groups, these baseline differences between eTICI groups did not translate into differences in relative growth between eTICI groups—the rate of change in growth was similar across the two eTICI groups, regardless of baseline differences.
There was no evidence that change in infarct volume varied by sex (P=0.77), age (P=0.56), collateral score (P=0.53), intravascular stroke lesion location (P=0.23), alteplase administration (P=0.62), and time from groin puncture to recanalization (P=0.16).
Association of post-EVT infarct growth and clinical outcomes
As seen in Figure 4A, the mean pre-stroke mRS was 0.41 (95% CI 0.24–0.68) and 90-day mRS was 2.77 (95% CI 2.16–3.40), with an odds ratio (OR) of 51.86 (95% CI 17.31–155.41), indicating a significant increase (P<0.01; median pre-mRS 0 [IQR 0–2] vs. 90-day mRS 2 [IQR 1–5]). As seen in Figure 4B, the mean initial NIHSS was 14.4 (95% CI 13.1–15.8) and the 24-hour score was 5.1 (95% CI 3.9–6.5), with an OR of 0.04 (95% CI 0.02–0.09), indicating a significant decrease (P<0.01; median initial score 14.5 [IQR 11–20] vs. 24-hour median score 3 [IQR 1–7]). There was no evidence that mRS varied by eTICI (P=0.19), neither did NIHSS vary by eTICI (P=0.79).
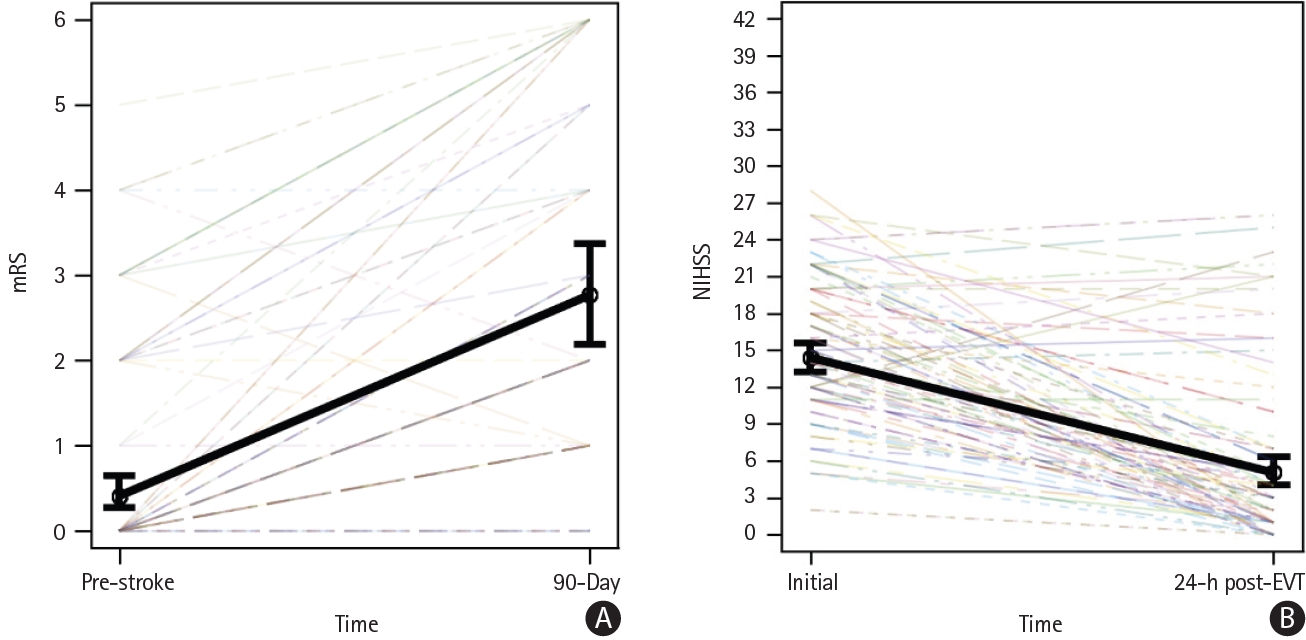
Pre-stroke and 90-day modified Rankin Scale (mRS) score (A) and pre-stroke and 24-hour National Institutes of Health Stroke Scale (NIHSS) (B). The black line illustrates the change for all patients along with 95% confidence limits. The colored lines are individual patients, demonstrating the range of initial and 90-day mRS/initial and 24-hour NIHSS.
When evaluating the association between infarct growth and clinical outcome, there was no statistically significant association observed between infarct growth and 90-day mRS (P=0.65) nor by growth and eTICI (P=0.11); however, for every one-unit (mL) increase in absolute post-EVT infarct growth, the odds of an increase in 24-hour NIHSS was 16% (OR: 1.16, 95% CI 1.09– 1.24, P<0.01). There was no evidence that this relationship differed by eTICI score (P=0.09). When using cubic spline regression to model the association of infarct growth with 24-hour NIHSS, it became evident that there was a near-linear relationship between infarct growth and 24-hour NIHSS in the 0–50 mL growth range, while the curve leveled off and was near-horizontal after 50 mL, indicating that above 50 mL infarct growth, larger growth volumes do not necessarily lead to an increase in 24-hour NIHSS (Supplementary Figure 1).
Discussion
We found that infarcts continue to grow between 2 hours and 24 hours post-EVT even when near-complete recanalization (eTICI 2c/3) is achieved. Although differences in baseline infarct volume between the eTICI 2c and eTICI 3 groups translated into similar differences in infarct volume at 24 hours, there were no differences in relative growth between the two eTICI groups; that is, the rate of change in growth was similar in eTICI 2c and eTICI 3 patients. Post-reperfusion infarct growth was associated with a worse NIHSS at 24 hours, with an OR of 1.16 for a 1-point NIHSS increase per mL increase in infarct growth.
The infarct growth observed in our study could in theory be due to measurement error. However, infarct measurements in our study were performed by experienced neuroradiologists on DWI-MRI, which the most accurate imaging modality for infarct assessment, and interrater agreement was good (publication under review). Another explanation for the observed infarct growth could be incomplete reperfusion, since eTICI 2c/3 denotes near-complete, rather than complete, reperfusion. Yet, we did observe infarct growth (median 2.6 mL) in eTICI 3 (complete reperfusion) patients as well. There may be other explanations for post-EVT infarct growth, such as impaired microvascular status or ongoing post-inflammatory changes. We did not find any differences in baseline or procedural variables that could explain infarct growth, but we did not capture all variables that may relevant. In particular, no inflammatory markers were captured that could reflect ongoing post-reperfusion inflammatory changes that have been hypothesized to cause post-EVT infarct growth [7].
While the traditional thinking has been that infarct growth in AIS stops once reperfusion has occurred, recent evidence suggests that several tissue damage mechanisms cause infarcts to grow even after reperfusion has been achieved [16]. The most important mechanisms in this regard seem to be (1) microvascular obstruction, (2) blood brain barrier breakdown, and (3) reperfusion injury [17].
At least part of the observed infarct growth in our study may be related to one or more of these three post-reperfusion tissue damage mechanisms. Conversely, “negative growth” in this study tended to be small, and is likely be artificial, due to measurement error, imaging error, or the combination of both.
Which post-tissue damage mechanisms were primarily responsible for the observed post-reperfusion infarct growth and to what extent remains unclear at this point. Investigating these mechanisms and their relative importance in greater detail would constitute a starting point to develop therapies aiming at reduction of post-reperfusion infarct growth.
There is a strong, albeit not perfect, relationship between infarct volume as well as infarct growth and clinical outcome (mRS) [18,19]. Data from the HERMES meta-analysis have shown that each 11 mL increase in 24-hour infarct volume lowers the probability of achieving good clinical outcome (mRS 0–2) by approximately 5% [20]. In the current study, post-reperfusion infarct growth was associated with worse short-term clinical outcome (higher NIHSS) at 24 hours, we did not observe an association with long-term clinical outcome (mRS). Potential explanations for this include the limited sample size of this study and the fact that the mRS is likely too crude an outcome measure to meaningfully capture improvement in eTICI 2c/3 patients who generally have smaller infarcts and do better compared to those with incomplete reperfusion. We decided to use this outcome nevertheless since it is the only widely accepted stroke outcome measure among healthcare policymakers and regulatory authorities [21].
Our study has several limitations. First, the sample size was limited and the study was likely underpowered to detect differences in clinical outcome. Furthermore, the fact that we did not find significant differences in baseline or procedural variables between patients with and without infarct growth may also be related to the small sample size. Second, we included patients with final eTICI 2c, which is not perfect reperfusion, and since eTICI does not perfectly capture reperfusion at a tissue level, even patients with eTICI 3 may have some non-reperfused tissue that is not visible on angiography. Thus, some degree of infarct growth may be simply explained by infarction of small non-reperfused areas. Advanced MRI techniques such as MR perfusion and quantitative T2 imaging may provide a more accurate assessment of reperfusion and may be able to overcome this limitation [9,22], but they are more challenging to conduct in the acute clinical setting. Third, infarct measurements were performed manually, which is subject to some degree of measurement error, given imaging error and perceptional differences, although the measurements were performed by experienced neuroradiologists and interrater variability was good.
Conclusions
Infarcts seem to continue to grow slightly after EVT, even if near-complete or complete reperfusion is achieved. Absolute (median) infarct growth between 2 and 24 hours post-EVT was 4.5 mL. The underlying mechanisms should be investigated as a starting point for future therapies that prevent post-reperfusion infarct growth.
Supplementary materials
Supplementary materials related to this article can be found online at https://doi.org/10.5853/jos.2023.02621.
Differences in baseline and procedural variables between patients with and without infarct growth between 2 hours and 24 hours
24-hour National Institutes of Health Stroke Scale (NIHSS) as a function of infarct growth between 2 and 24 hours after endovascular treatment (obtained from cubic spline regression). Light blue shading indicates the 95% confidence interval.
Notes
Funding statement
None
Conflicts of interest
Mayank Goyal is a consultant for Medtronic, Stryker, Microvention and Mentice. Johanna Ospel is a consultant for NICOLab. The remaining authors have nothing to disclose.
Author contribution
Conceptualization: JO, GB, NR, MG, RMcT. Study design: GB. NR, JO. Methodology: GB. NR, JO. Data collection: all authors. Investigation: all authors. Statistical analysis: GB. Writing—original draft: JO, GB. Writing—review & editing: all authors. Funding acquisition: RMcT, GB. Approval of final manuscript: all authors.