Circulating Extracellular-Vesicle-Incorporated MicroRNAs as Potential Biomarkers for Ischemic Stroke in Patients With Cancer
Article information
 , Eun Hee Kim2,*, Mi Jeong Oh3, Jaein Yoo3,4, Gyun Sik Oh2, Jong-Won Chung1, Woo-Keun Seo1, Gyeong-Moon Kim1, Myung-Ju Ahn5, Seong Wook Yang6, The Investigators of the OASIS-CANCER Study
Abstract
Background and Purpose
This study aimed to evaluate whether extracellular-vesicle-incorporated microRNAs (miRNAs) are potential biomarkers for cancer-related stroke.
Methods
This cohort study compared patients with active cancer who had embolic stroke of unknown sources (cancer-stroke group) with patients with only cancer, patients with only stroke, and healthy individuals (control groups). The expression profiles of miRNAs encapsulated in plasma exosomes and microvesicles were evaluated using microarray and validated using quantitative real-time polymerase chain reaction. The XENO-QTM miRNA assay technology was used to determine the absolute copy numbers of individual miRNAs in an external validation cohort.
Results
This study recruited 220 patients, of which 45 had cancer-stroke, 76 were healthy controls, 39 were cancer controls, and 60 were stroke controls. Three miRNAs (miR-205-5p, miR-645, and miR-646) were specifically incorporated into microvesicles in patients with cancer-related stroke, cancer controls, and stroke controls. The area under the receiver operating characteristic curves of these three miRNAs were 0.7692–0.8510 for the differentiation of patients with cancer-stroke from cancer-controls and 0.8077–0.8846 for the differentiation of patients with cancer-stroke from stroke controls. The levels of several miRNAs were elevated in the plasma exosomes of patients with cancer, but were lower than those in plasma microvesicles. An in vivo study showed that systemic injection of miR-205-5p promoted the development of arterial thrombosis and elevation of D-dimer levels
Conclusion
Stroke due to cancer-related coagulopathy was associated with deregulated expression of miRNAs, particularly microvesicle-incorporated miR-205-5p, miR-645, and miR-646. Further prospective studies of extracellular-vesicle-incorporated miRNAs are required to confirm the diagnostic role of miRNAs in patients with stroke and to screen the roles of miRNAs in patients with cancer.
Introduction
Systemic cancer and ischemic stroke are common conditions and are among the most frequent causes of death among the elderly. The association between cancer and stroke has been reported worldwide. The incidence of cancer-related stroke is expected to increase because of the advances in cancer treatment and the growth of aging population worldwide. Cancer-related stroke has a unique pathomechanism and may be a distinctive stroke subtype [1].
D-dimer is the most commonly used clinical marker for diagnosing venous thromboembolism (VTE), pulmonary embolism, and stroke in cancer patients [2]. However, the D-dimer test often gives false positive results and has low specificity and limitations in measurements; hence, a more reliable biomarker is required for accurately diagnosing cancer-related thrombosis [2]. Great interest has been directed to liquid biopsy, which can identify novel biomarkers in biological fluids. They have been extensively studied in patients with VTE, but relatively rarely in patients who suffered stroke [3]. Circulating extracellular-vesicle (EV)-incorporated microRNAs (miRNAs) may be highly specific or sensitive diagnostic and prognostic markers because they are found in nearly all biological fluids. Cancer and normal cells express and package different sets of miRNAs into EVs. EVs are relatively stable in the bloodstream, whereas miRNAs have a short half-life in the circulation [4]. Further, miRNAs are short stretches of single-stranded endogenous, non-coding RNAs that play a significant role in RNA silencing and post-transcriptional gene expression regulation [5]. Altered circulating EV miRNA profiles in patients with acute ischemic stroke and small vessel disease have been reported [6,7]. Several clinical trials are investigating the role of EV-associated miRNAs as diagnostic, predictive, and prognostic biomarkers in patients with cancer [8]. Till date, most studies have focused on the association of cancer cell-derived EVs and miRNAs with tumor-promoting inflammation and cancer cell cytotoxicity; however, no study has evaluated the role of miRNAs in stroke caused by cancer-associated coagulopathy [9,10].
We hypothesized that EV-miRNAs are potential biomarkers of cancer-related stroke. Therefore, we first investigated EV-miRNA profiles that are dysregulated in patients with cancer-related stroke compared to cancer patients without stroke, and thereafter, we investigated the diagnostic value of the identified miRNAs to differentiate cancer-related stroke from cancer-unrelated stroke. In this study, we evaluated the expression profile of miRNAs encapsulated in exosomes and microvesicles separately because significant differences have been reported in terms of size, markers, and biogenesis between exosomes and microvesicles [11]. Second, the microvesicle-miRNA levels in patients with cancer-stroke were quantitatively compared with those in patients with cancer only and patients with stroke only in the validation cohort. Third, the correlations between miRNA expression pattern and other circulating markers such as D-dimer and markers of neutrophil extracellular traposis (NETosis) were evaluated. Finally, target gene analyses and an in vivo study of miRNA-mediated arterial thrombosis were performed.
Methods
This study is a part of the Optimal Anticoagulation Strategy in Stroke Related to Cancer (OASIS-CANCER) study (URL: https://www.clinicaltrials.gov; unique identifier: NCT02743052). The data that support the findings of this study are available from the corresponding author upon reasonable request. The study design is presented in Figure 1.
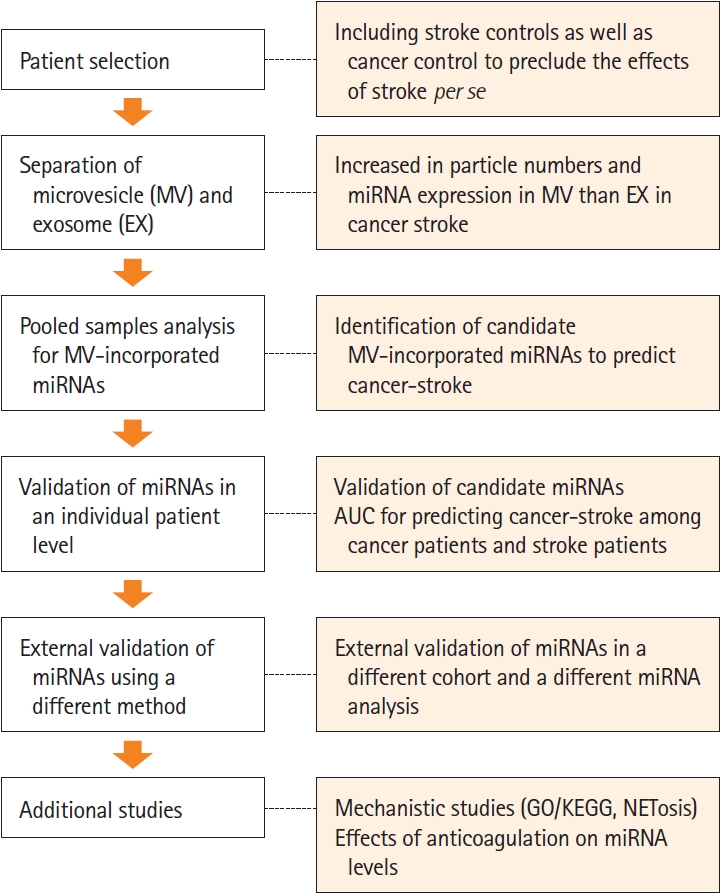
Study design. miRNA, microRNA; AUC, area under the receiver operating characteristic curve; KEGG, Kyoto Encyclopedia of Genes and Genomes; GO, Gene Ontology; NETosis, neutrophil extracellular traposis.
Patient selection
We prospectively studied consecutive patients with cancerstroke (the CS group) who were admitted to a University Medical Center between April 2013 and May 2018. The inclusion criteria were (1) acute ischemic embolic stroke documented based on diffusion-weighted imaging (DWI) within 7 days after symptom onset due to embolic stroke of unknown source; (2) known or newly diagnosed active cancer at the time of stroke diagnosis, after stroke, or during hospitalization; (3) patients who collect blood samples before anticoagulation administration; and (4) hypercoagulability state, defined as D-dimer concentration >3 μg/mL [12]. Patients who had no conventional stroke mechanisms such as atrial fibrillation or carotid stenosis were excluded because cancer-specific mechanisms were unlikely to play a role in the development of stroke in these patients [13]. Patients were considered to have active cancer if they were diagnosed with cancer, underwent treatment within 6 months before enrollment, or had recurrent/metastatic cancer. We excluded patients who did not provide blood samples before anticoagulation treatment.
Healthy individuals (the HC group), patients with stroke and without cancer (stroke-controls, the SC group), and patients with active cancer and without stroke (cancer-controls, the CC group) served as control groups. Patients admitted for ischemic stroke at a University Medical Center between April 2016 and May 2018 were recruited consecutively as the SC group. The inclusion criteria were (1) acute ischemic embolic stroke documented on DWI within 7 days after symptom onset, (2) no history of cancer, and (3) no use of oral anticoagulants prior to stroke. Patients with locally advanced or systemic metastatic lung cancer (mostly adenocarcinoma) without a history of stroke were recruited as the CC group. Healthy subjects without a history of stroke or cancer, healthy spouses, or healthy volunteers served as the HC group. For all the groups, earlier-presenting patients were used for developing cohort and later-presenting patients were used for validation cohort.
All participants or their next of kin provided informed consent for the participation in the study. The local institutional review board approved this study (IRB No. SMC2016-02-104). The details of patients’ selection and work-up for stroke subtype are provided in Supplementary Method and Supplementary Figure 1.
Isolation of microvesicles and exosomes
Citrated whole blood samples were centrifuged at 2,000×g for 15 minutes to obtain citrate plasma samples, which were stored at -80°C until further analysis. To isolate EVs (microvesicles and exosomes), citrate plasma was centrifuged at 1,000×g for 10 minutes at 4°C. The supernatant was centrifuged at 19,800×g for 20 minutes to obtain microvesicles; thereafter, the final supernatant was ultracentrifuged at 100,000×g for 1 hour to obtain exosomes. Samples were centrifuged at 4°C using an Optima TLX ultracentrifuge (Beckman Coulter, Brea, CA, USA) and a TLA120.2 rotor. Pellets were resuspended in filtered phosphate buffered saline (PBS) and re-centrifuged at 100,000×g for 1 hour at 4°C in the same tubes. The final pellet containing EVs was resuspended in 100 μL PBS.
Characterization of microvesicles and exosomes
EVs (microvesicles and exosomes) were pre-diluted in vesiclefree water, and the concentration and size distribution of EVs were characterized using a NanoSight NS300 system (Malvern, Worcestershire, UK). The mean size and concentration (particles/mL) were calculated by integrating data from three individual measurements.
EVs were fixed with 1% OsO4 dissolved in 0.1 M phosphate buffer (PB) for 2 hours. The electron microscopy (EM) grid was placed Formvar side down on top of the EV drop for approximately 1 minute. The grid was removed, blotted with filter paper, and placed onto a drop of 2% uranyl acetate for 15 seconds. Thereafter, excess uranyl acetate was removed and the EM grid was examined and photographed using a transmission electron microscope (TEM; JEM-1011, JEOL, Tokyo, Japan).
Direct visualization of EVs was examined using a cryo-TEM. Carbon grids (Quantifoil, R1.2/1.3, 200 mesh, EMS; Hatfield, PA, USA) were made hydrophilic with glow-discharge using the Pelco EasiGlow system (TED PELLA, Redding, CA, USA). An aliquot (4 μL) of samples was placed to the carbon side of the EM grid and blotted for 1.5 seconds with 100% humidity at 4°C. The sample was plunge-frozen into precooled liquid ethane using Vitrobot Mark IV (FEI, Hillsboro, OR, USA). The samples were analyzed using a cryo-electron microscope Talos L120C (FEI) at 120 kV.
The total protein content of EVs was quantified using a Pierce micro bicinchoninic acid (microBCA) Protein Assay Kit (Thermo Fisher Scientific, Rockford, IL, USA) according to the manufacturer’s instructions. A total of 15 μg of EV protein was separated by sodium dodecyl sulfate-polyacrylamide gel electrophoresis and transferred to nitrocellulose membranes (Bio-Rad, Hercules, CA, USA). The membranes were incubated with primary antibodies against CD63 and HSP70 (1:1,000, Cell Signaling Technology, Beverly, MA, USA), CD81, TSG101, or calnexin (1:1,000, Santa Cruz Biotechnology, Santa Cruz, CA, USA) overnight at 4°C; thereafter, the membranes were incubated with horseradish peroxidase (HRP)-conjugated secondary antibodies (1:1,000, anti-rabbit or anti-mouse, Cell Signaling Technology) for 2 hours. Proteins were detected using a chemiluminescence substrate from Thermo Fisher Scientific, Inc. (Waltham, MA, USA) and were visualized on an X-ray film (Agfa, Mortsel, Belgium).
RNA isolation
The total RNA of EVs was extracted using the miRNeasy Serum/Plasma Kit (Qiagen, Hilden, Germany) according to the manufacturer’s instructions. To normalize sample-to-sample variation, Caenorhabditis elegans miR-39 (Qiagen) was added to each sample before RNA extraction. Extracted RNA was eluted in 14 μL RNase-free water and stored at -80°C. The concentration of RNA was quantified using a NanoDrop 1000 spectrophotometer (NanoDrop, Wilmington, DE, USA).
miRNA profiling and validation
The expression profile of miRNAs encapsulated in plasma EVs (exosomes and microvesicles) was evaluated using microarray and was validated using the quantitative real-time polymerase chain reaction (qRT-PCR) and XENO-QTM miRNA assay technology (XENOHELIX, Incheon, Korea).
The expression profiles of miRNAs in pooled samples (CS group: n=10, CC group: n=10, and HC group: n=10) were evaluated using the Human whole-miRNome Array by qRT-PCR and the miScript SYBR green PCR kit (Qiagen) following the manufacturer’s instructions. A total of 4 μL of RNA was reverse-transcribed to cDNA using the miScript II RT Kit (Qiagen) for qRT-PCR. A 1:20 dilution of reverse-transcribed (RT) products was used as the template for PCR. We performed qRT-PCR of synthetic miRNAs miRTC, positive PCR control, and housekeeping references in 384-well plates using the ABI 7900HT Real-Time PCR System (Applied Biosystems, Foster City, CA, USA). Raw data were normalized against the reference miRNAs in all plates. The global Ct (cycle threshold) mean was used to normalize Cq (quantification cycle) values.
To validate the miRNome array experiments for EV-miRNAs, we performed qRT-PCR of selected EV-miRNAs using total RNA isolated from the EVs of the second cohort (HC group: n=38, CC group: n=13, CS group: n=22, and SC group: n=40) and analyzed the results of qRT-PCR using the 2-ΔCt quantitative method. An miRNA with a Cq value of <35 and a 5-fold increase compared with the HC group was selected. The primers for miRNAs were analyzed using TaqMan® MicroRNA Assays (Applied Biosystems).
Sequencing based validation of miRNA
External validation was performed using three selected miRNAs from different cohorts using different miRNA analysis methods.
The XENO-QTM miRNA assay technology (CAT: 93661000, XENOHELIX) is a novel method for miRNA detection that uses xenosensors (www.XENOHELIX.com). Each 150 nt xeno-sensor consists of sequences that complement a specific miRNA and barcode information for tracking individual patients. Three different sensors for three miRNAs were mixed with total EV miRNA. Hybridization of a xeno-nucleic acid sensor and a target miRNA resulted in the identification of hybridized miRNA as a primer by Xeno-polymerase to synthesize an RNA-DNA chimera strand for 10 minutes. After polymerization of the complementary strand to the sensor, unbound sensors and non-specific RNAs were removed with nuclease treatment for 20 minutes followed by filtration. Thereafter, the newly synthesized RNA-DNA chimera strands were amplified and monitored by real-time PCR. In addition, absolute miRNA copy numbers present in the samples were determined from the log-linear portion of the quantifiable standard curves for each synthetic target miRNA. A1 artificial miRNA and its sensor were added to each sample to calibrate the PCR amplification process. The copy numbers of A1 artificial miRNA in each sample were used as PCR reaction controls.
The barcode modules of the synthesized RNA-DNA chimera strands were specifically amplified using the XENO-ONTTM miRNA sequencing kit (CAT: 93666680, XENOHELIX) for 1 hour, instead of performing real-time PCR. The amplified barcode modules of the RNA-DNA chimera strands were processed using the SQK-LSK109 Ligation Sequencing Kit (Oxford Nanopore Technology, Oxford, UK). The processed products were loaded on a MinION sequencer (Oxford Nanopore Technology) for sequencing analysis for 4 hours. The raw sequencing data were analyzed using the XENO-ONT Readout program (XENOHELIX) to determine the copy numbers of the target miRNAs.
Bioinformatics analysis of miRNAs
After confirming that the data were properly normalized (miRNA profiles were analyzed using the Human whole-miRNome Array), differentially expressed miRNAs that showed a difference of more than 2.0 folds between the average signal values of the HC, CC, and CS groups were selected manually. To classify the co-expression of miR groups with similar expression patterns, hierarchical clustering analysis was performed using the Multi Experiment Viewer (MEV) software version 4.9.0 (https://webmev.tm4.org/). We detected the function of selected differentially expressed miRNAs in target genes using the Kyoto Encyclopedia of Genes and Genomes (KEGG) and Gene Ontology (GO) pathway analysis. GO and KEGG pathway enrichment analyses were performed using the miRWalk2.0 web-based tool (http://mirwalk.umm.uniheidelberg.de/). Potential targets for miRNAs were predicted based on the RNA22 database (https://cm.jefferson.edu/rna22).
Cell culture and transient transfection
Human umbilical vein endothelial cells (HUVECs) were maintained in EBMTM-2 Basal Medium (Lonza, Basel, Switzerland; Cat# CC-3156) supplemented with EGMTM-2 SingleQuotsTM supplements (CC-4176) required for growth of endothelial cells. For miRNA transfection, 4×10⁵ cells were plated in 60 mm2 culture dish and transfected with 60 nM of miRNA mimics for 6 hours. Control miRNA and miRNA mimics were purchased from Bioneer (Daejeon, Korea) and transfection was performed using LipofectamineTM RNAiMAX transfection reagent (Thermo Fisher Scientific, Cat#13778150) following manufacturer’s protocol. After 24 hours, cells were harvested and assessed with appropriate assay.
Western blot analysis
HUVECs were lysed using radioimmunoprecipitation assay (RIPA) buffer containing protease inhibitor. Total 10 μg of cell lysate were separated by SDS-polyacrylamide gel electrophoresis (Invitrogen, Waltham, MA, USA; Cat# XP08162BOX) and transferred to 0.45 μm nitrocellulose membranes (Bio-Rad, Cat#1620115). After blocking, membranes were incubated with the respective primary antibody for overnight at 4°C, washed three times in TBS-t for 10 minutes, and incubated with the appropriate secondary antibody for 1 hour at room temperature. Data were visualized with chemiluminescence imaging system (VILBER, Eberhardzell, Germany; Fusion SOLO S).
NET-specific biomarkers and D-dimer
In addition, plasma DNA and nucleosome were evaluated as NETspecific biomarkers [14-16]. Plasma DNA and nucleosomes were analyzed using the Quant-iT PicoGreen dsDNA assay (Invitrogen) and Cell Death Detection ELISA (enzyme-linked immunosorbent assay) kit (Roche, Basel, Switzerland), respectively. Finally, the D-dimer level, a nonspecific marker of hypercoagulability, was measured as per the protocol. Personnel (M.J.O. and G.S.O.) who conducted the blood assays were blinded to the clinical and laboratory data.
The effect of miR-205-5p in a mouse model of carotid artery thrombosis
We evaluated the effect of miR-205-5p on thrombosis in an animal model of thrombosis. Control agomir (cat# B04008) and hsa-miR-205-5p agomir (cat# B06001) were purchased from Genepharma (Shanghai, China). Rose bengal (cat# 330000) was purchased from Merck (Darmstadt, Germany). C57BL/6N mice 8 weeks old were purchased from the Orient Bio Inc. (Sungnam, Korea). All animal experiments were approved by Institutional Animal Care and Use Committee of Samsung Medical Center (approval number 202209290004). Mice were housed at 25°C on a 12-hour light-dark cycle and fed ad libitum standard chow diet and water. For systemic miRNA delivery, mice were injected with 10 nM control agomir or hsa-miR-205-5p agomir 24 hours before the surgery of modelling. Mice were anesthetized using mixture of ketamine (50 mg/kg) and xylazine (10 mg/kg) via intraperitoneal injection. Mice were placed in supine position and keep its neck in a straight. A midline cervical incision was performed, and the right common carotid artery and left jugular vein were isolated under a surgical microscope. Carotid blood flow was monitored using 2D laser Blood Flow Imager (OZ-2 STD, Omegawave, Fuchu, Tokyo, Japan). Thrombosis was induced on the common carotid artery by exposure to 532 nm green laser (GL532T3-150FC, Laser Century, Shanghai, China) 2 minutes after 50 mg/kg rose bengal injection via jugular vein. Real time blood flow was monitored during laser exposure. Occlusion time was determined as the starting point at which blood flow remained under 25% at least 1 minute. For histologic analysis, mice exposed to laser for 16 minutes and then perfused in 4% paraformaldehyde solution. The common carotid arteries were embedded in OCT compound (6200, Tissue-Tek; Sakura FineTek, Torrance, CA, USA) and longitudinally cryosectioned 10 μm thick. The sections were stained using hematoxylin and eosin. Blood samples were collected at the end of laser exposure via cardiac puncture. Plasma D-dimer was measured using mouse D-dimer ELISA kit (abx258705, Abbexa, Cambridge, UK) according to manufacturer’s instrument.
Statistical analysis
Differences in discrete variables between the groups were evaluated using the χ2, Fisher’s exact, or Mann–Whitney U test. Differences in continuous variables were evaluated using one-way analysis of variance (ANOVA), Kruskal–Wallis test, or t-test. The Dunnett’s method was used for multiple comparison tests. We used receiver operating characteristic (ROC) curves to compare the discrimination power of each plasma EV-miRNA and combinations of miRNAs for predicting cancer-related stroke. We assessed the discrimination power by calculating the area under the ROC curve. An area of 1 implied that the test has perfect sensitivity and specificity, whereas an area of 0.5 implied that the model’s predictions are no better than chance. The best model was defined as the model with the largest ROC curve. A twotailed P value of <0.05 was considered statistically significant. All statistical analyses were performed using a commercially available software (SPSS Statistics version 24.0, IBM Corp., Armonk, NY, USA).
Results
Patients’ characteristics
This study recruited 220 patients, of which 45 patients had cancer-stroke (the CS group), 76 healthy controls (the HC group), 39 cancer controls (the CC group), and 60 stroke controls (the SC group). The characteristics of patients in the developing and validation cohorts are summarized in Supplementary Tables 1 and 2, respectively. In both the developing and validation cohorts, patients from the SC group were older than those from other groups. In both the CC and CS groups, lung cancer was the most common type of cancer and most patients had metastasis.
Plasma microvesicle and exosome levels in patients with cancer-related stroke
The characterization of exosomes and microvesicles is shown in Figure 2. Cryo-TEM analysis revealed that most EVs had a round shape with an electron-dense structure and that the mode diameters of microvesicles and exosomes were 123±4.3 nm and 116.4±4.3 nm, respectively (Figure 2B). The circulating EVs were positive for EV markers such as CD63 and TSG101 and negative for calnexin, an EV negative marker (Figure 2D).
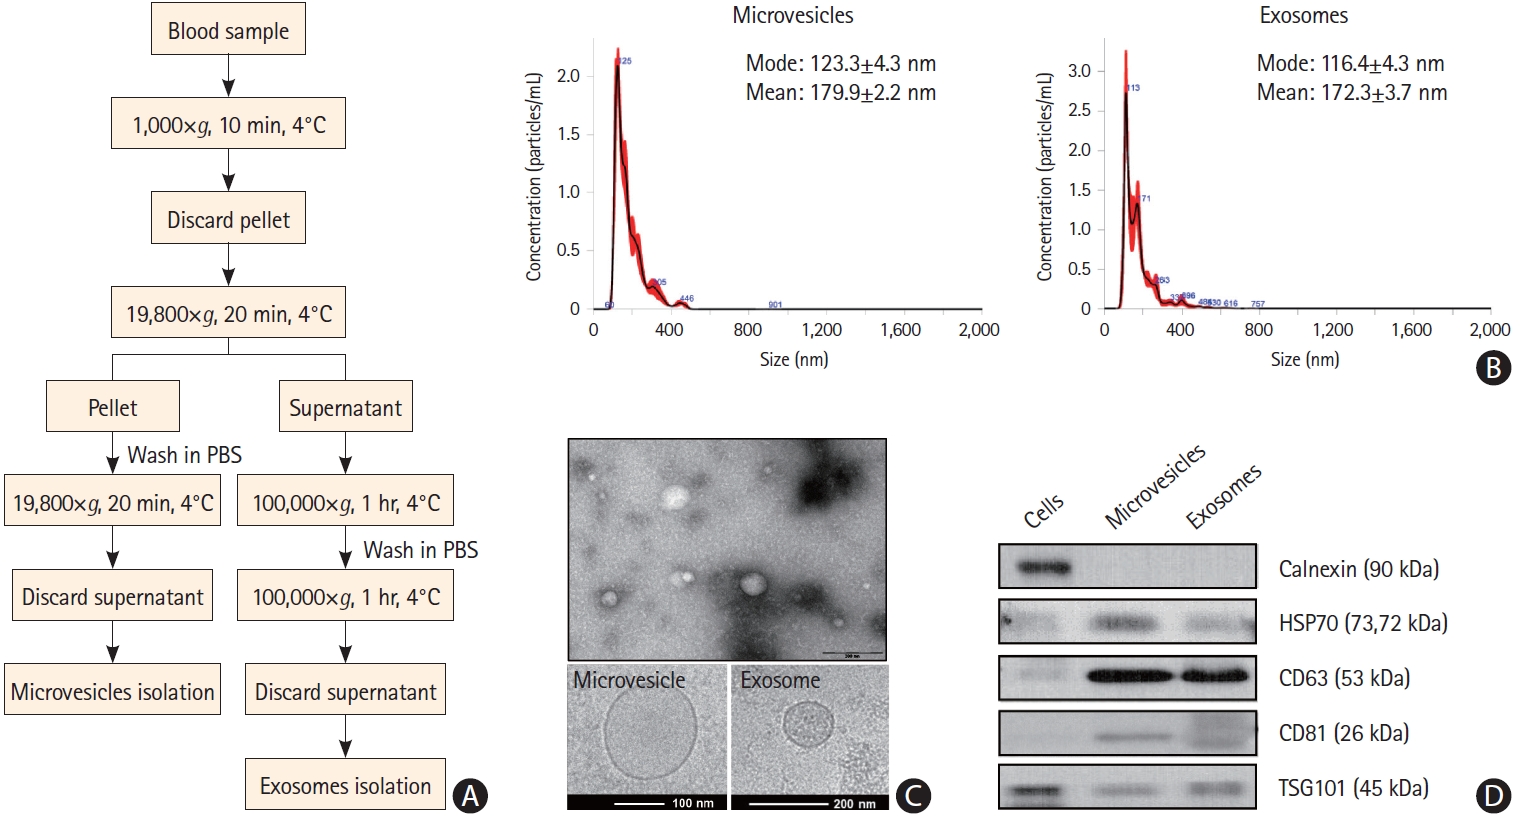
Characteristics of plasma extracellular vesicles. (A) Process for the isolation of exosomes and microvesicles. (B) Size distribution of microvesicles and exosomes, as determined by NanoSight Tracking Analysis. (C) Size and lipid double layers of purified exosomes and microvesicles, as determined by electron microscopy. (D) Western blot analysis of extracellular vesicle markers of microvesicles and exosomes. PBS, phosphate buffered saline.
Compared with the CC and SC groups, the CS group had a higher total number of circulating microvesicles in the plasma, but without significance (Supplementary Figure 2A). The number of circulating exosomes did not differ among the groups (Supplementary Figure 2B). In addition, plasma microvesicle levels did not change with the use of anticoagulation in the CS group (Supplementary Figure 2C).
miR-205-5p, miR-645, and miR-646 were incorporated into microvesicles in patients with cancer-related stroke
Identification of microvesicle-miRNA profiles in patients with cancer-related stroke in a developing cohort
The expression profiles of miRNA in pooled samples of microvesicles were different in the CS and CC groups compared with the HC group (n=10 for each group) (Figure 3). Of these, the levels of 20 miRNAs were elevated in both cancer-stroke patients and cancer-controls, and those of 12 miRNAs were elevated in plasma microvesicles of cancer-stroke patients compared with those of healthy individuals over 5-fold.
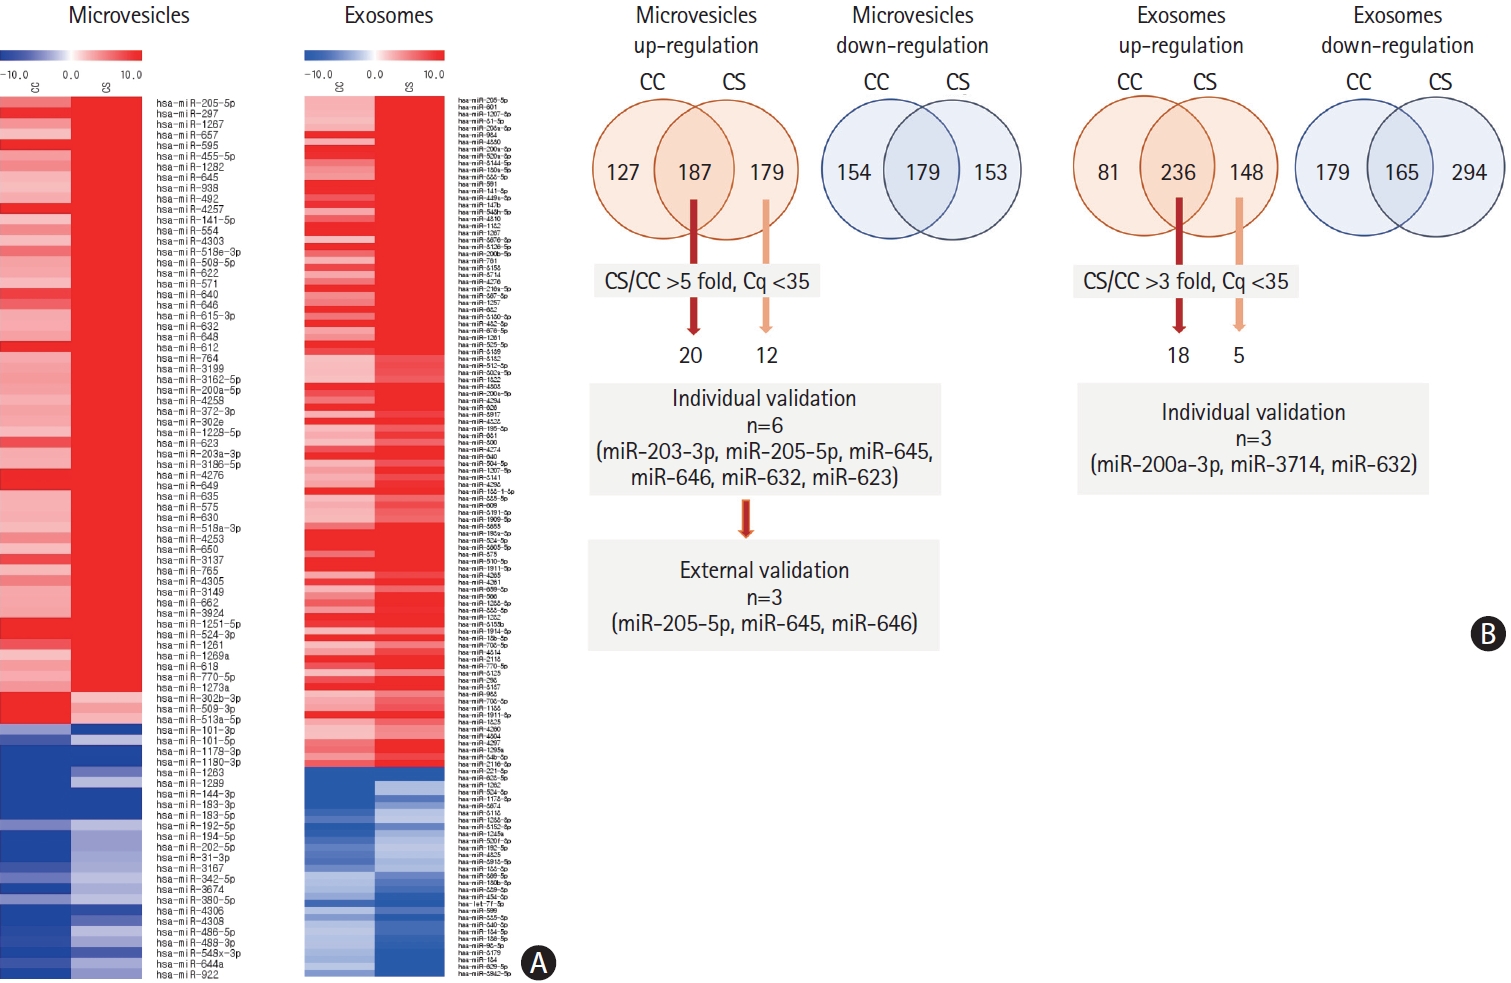
Analysis of plasma microvesicle-microRNAs in pooled samples of patients with cancer and stroke and patients with cancer and without stroke. (A) Microarray data of pooled samples of patients with cancer only (cancer-control [CC]) and patients with cancer-stroke (CS). (B) Venn diagrams of increased levels of microRNAs identified in exosomes and microvesicles of patients with CC and those with CS. The numbers represent the number of microRNAs that were increased in microvesicles (more than 5 folds) and exosomes (3 folds) compared with health individuals at Ct (cycle threshold) less than 35.
We tested the miRNA levels at the individual patient level and found that miR-205-5p, miR-645, miR-646, miR-203a-3p, miR-632, miR-623, and miR-606 were increased in microvesicles in the CS group (Figure 4A). The area under the ROC curves for differentiation of the CS and CC groups according to the individual miRNA levels were calculated and found to be ranging from 0.754 to 0.924 (Figure 4B). Likewise, several miRNAs (i.e., miR-632, miR-200a-3p, and miR-3714) were significantly increased in the plasma exosomes in the CS group, but had relatively lower levels than those in plasma microvesicles.
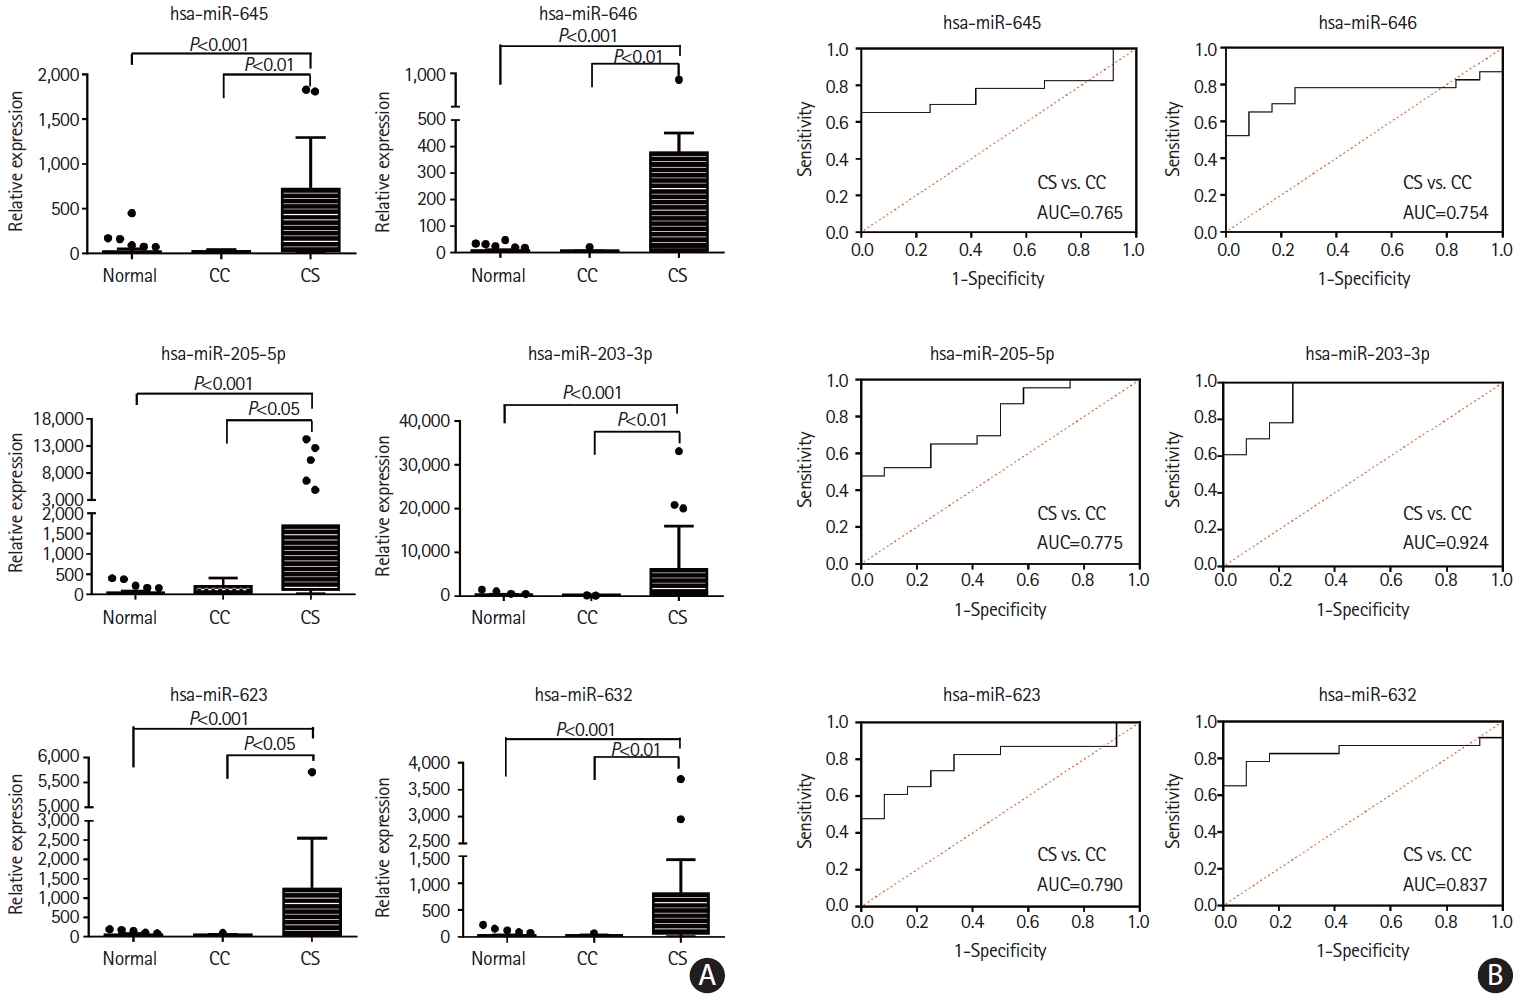
Analysis of plasma microvesicle microRNAs in individual samples of patients with cancer. (A) Quantitative real-time polymerase chain reaction (qRTPCR) results of relative abundance of microvesicle-microRNAs in patients with cancer-stroke (CS) compared with healthy controls and cancer controls (CC). (B) Receiver operating characteristics curve for cancer-stroke in patients with cancer. AUC, area under the receiver operating characteristics curve.
To assess whether miRNA levels were elevated by stroke per se, microvesicle-miRNA levels were compared between the CS and SC groups. Three miRNAs, namely miR-205-5p, miR-645, and miR-646, were significantly increased in the CS groups compared with the SC group (Figure 5). We calculated the area under the ROC curves for distinguishing the CS group from the SC group according to the individual miRNA levels and combination of individual miRNA levels. The area under the ROC curve varied between 0.7095 and 0.8190 (Figure 5). The discriminating ability of all three miRNAs (miR-205-5p, miR-645, and miR-646) was higher (area under the ROC curve, 0.8810, 95% confidence interval, 0.7632–0.9987) than those of individual miRNAs. Multivariate analysis (forward conditioned model) revealed that the miR-205-5p level (odds ratio 1.237, 95% confidence interval, 1.056–1.449, P=0.008) was associated with cancer stroke among patients with stroke after adjusting for age, sex, and vascular risk factors. On the contrary, plasma exosome-miRNA levels were not significantly different between the CS and SC groups.
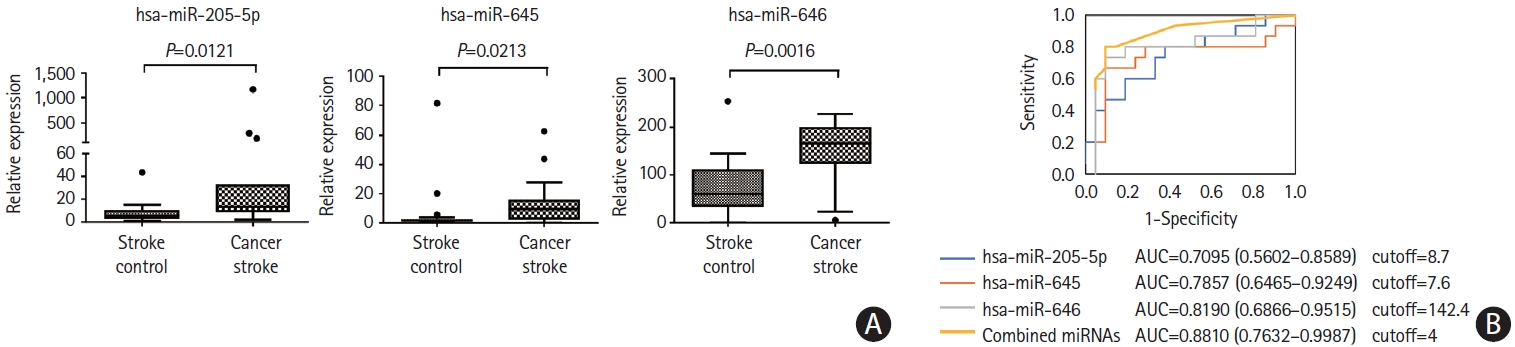
Analysis of plasma microvesicle microRNAs (miRNAs) in individual samples of patients with stroke. (A) Quantitative real-time polymerase chain reaction (qRT-PCR) results of relative abundance of microvesicle-miRNAs in patients with cancer-stroke compared with stroke-controls. (B) Receiver operating characteristics curve for cancer stroke in patients with stroke. The cutoff score was 8.2-fold for miR-205-5p, 5.6-fold for miR-645, and 129.2-fold for miR- 646 (as normalized with miR-39, a spike-in control). AUC, area under the receiver operating characteristics curve.
Quantitative analysis of microvesicle miRNA profiles in a validation cohort
The miR-205-5p, miR-645, and miR-646 levels were assessed at the individual patient level for the external validation test using samples obtained from a validation cohort. A quantitative analysis of the absolute copy numbers of individual miRNAs using the XENO-Q miRNA detection assay confirmed that the levels of all three miRNAs were higher in the CS group than in the CC and SC groups (Figure 6A and B). The analyses of area under the ROC curves to determine the discrimination power of microvesicle-miRNAs for the differentiation of the CS group from the CC group range: 0.7692–0.8510) or the SC group (range: 0.8077–0.8846) revealed similar results to those of the developing cohort. The absolute copy numbers of miRNAs for the diagnosis of cancer-stroke in the validation cohort are presented in Figure 6C.
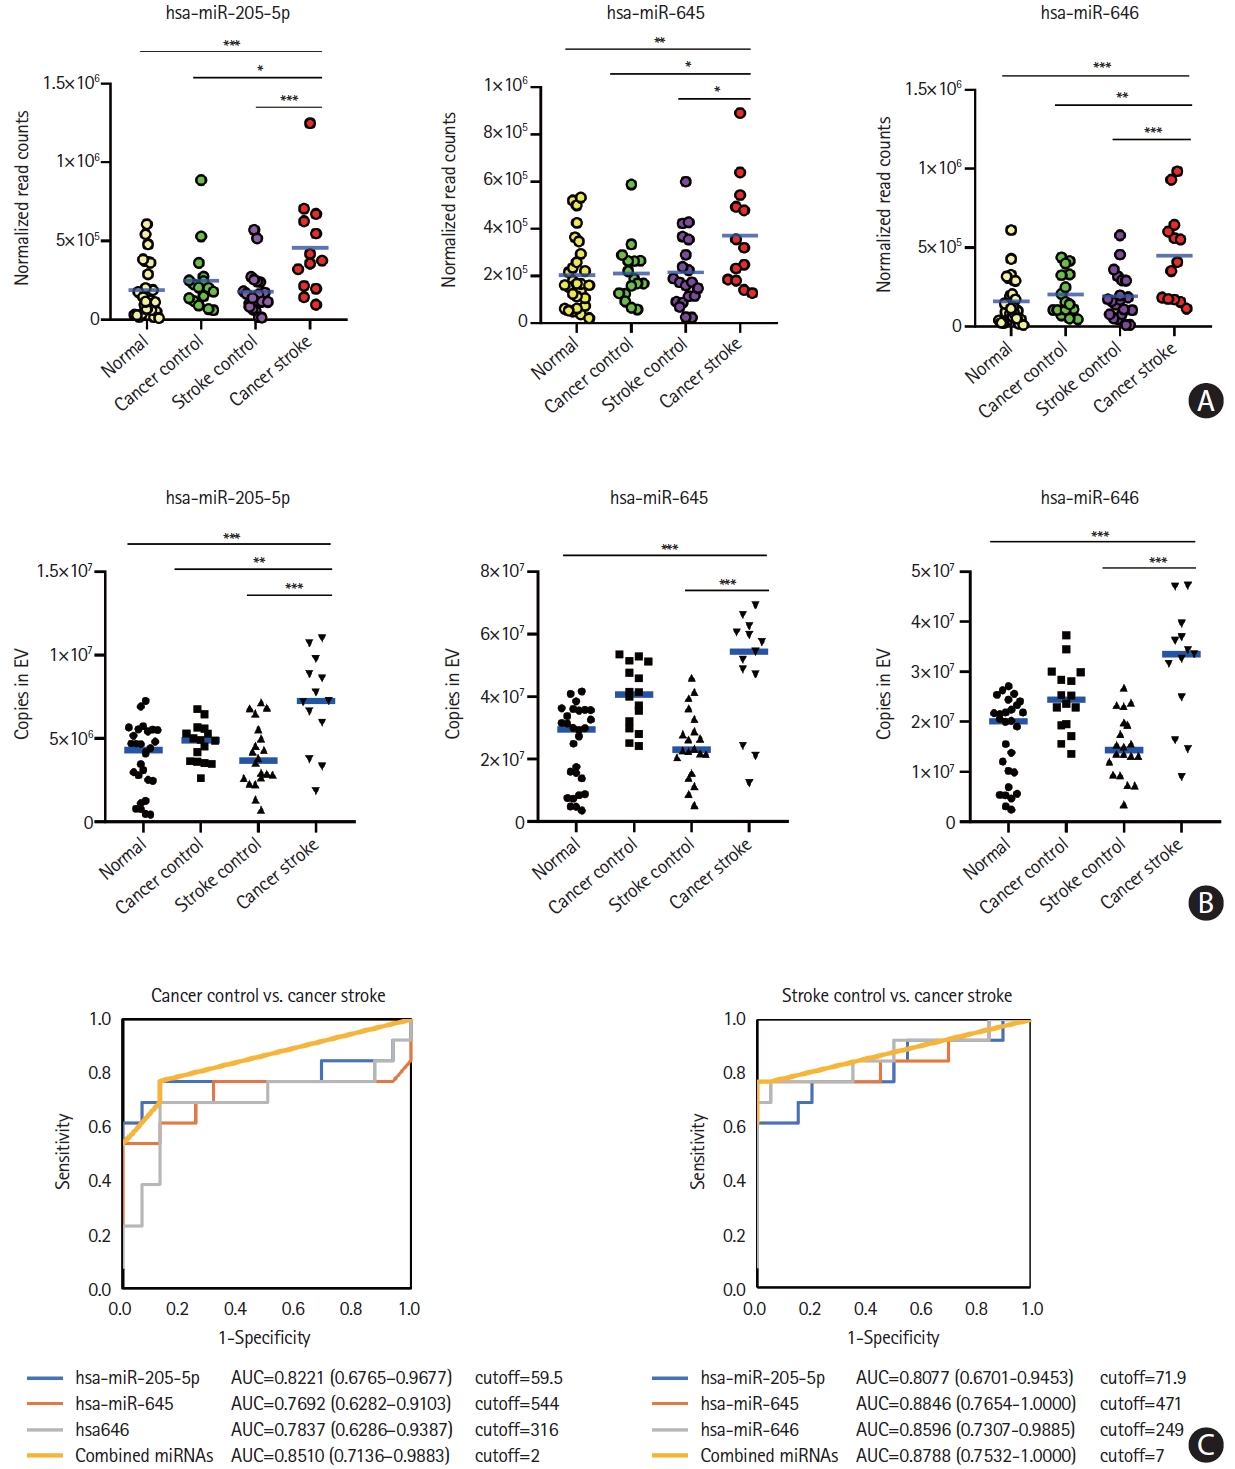
Microvesicle-incorporated microRNA (miRNAs) profiles of a validation cohort determined by xeno-sensors. (A) The absolute copy numbers of the three miRNAs within microvesicles were determined by performing XENO-ONT direct sequencing. (B) The expression of the three miRNAs within microvesicles was validated by performing the XENO-Q miRNA detection assay. (C) Receiver operating characteristic curve analysis of three miRNAs for the presence of cancer-related stroke vs. cancer control or stroke control. *P<0.05; **P<0.01; ***P<0.001. AUC, area under the receiver operating characteristics curve.
Underlying mechanisms of microvesicle-miRNAs in cancer-stroke
We detected the function of expressed microvesicle-miRNAs in target genes through KEGG and GO pathway analyses. The KEGG pathways related to enriched miRNAs in microvesicles in the CS group were linked to pathways in cancer, the Janus kinase/signal transducer and activator of transcription (JAK/STAT) signaling pathway, cell adhesion molecules, and cell cycle. Similarly, GO analysis revealed that they were linked to the cell cycle, cell differentiation, neurogenesis, phosphorylation, cell adhesion, and cell development (Figure 7A and B). In particular, the three miRNAs interacted with the target genes related to the positive regulation of cell-matrix adhesion, central nervous system development, and peptidyl-serine phosphorylation. Analysis of the prediction program (RNA22, https://cm.jefferson.edu/rna22) was performed to select the target genes of the three miRNAs, and they were found to interact with vascular endothelial growth factor A (VEGF-A). To confirm the regulation of VEGF-A by the three miRNAs, HUVECs were transfected with con-miR, pre-miR-205-5p, pre-miR-645, or pre-miR-646. VEGF-A mRNA levels were significantly reduced in HUVECs transfected with pre-miR-645 (P<0.01), and overexpression of miR-205-5p and miR-646 tended to decrease the expression levels of VEGF mRNA (Figure 7C). Western blotting showed that the overexpression of miR-645 in HUVECs reduced the VEGF-A protein level (P<0.01) (Figure 7D).
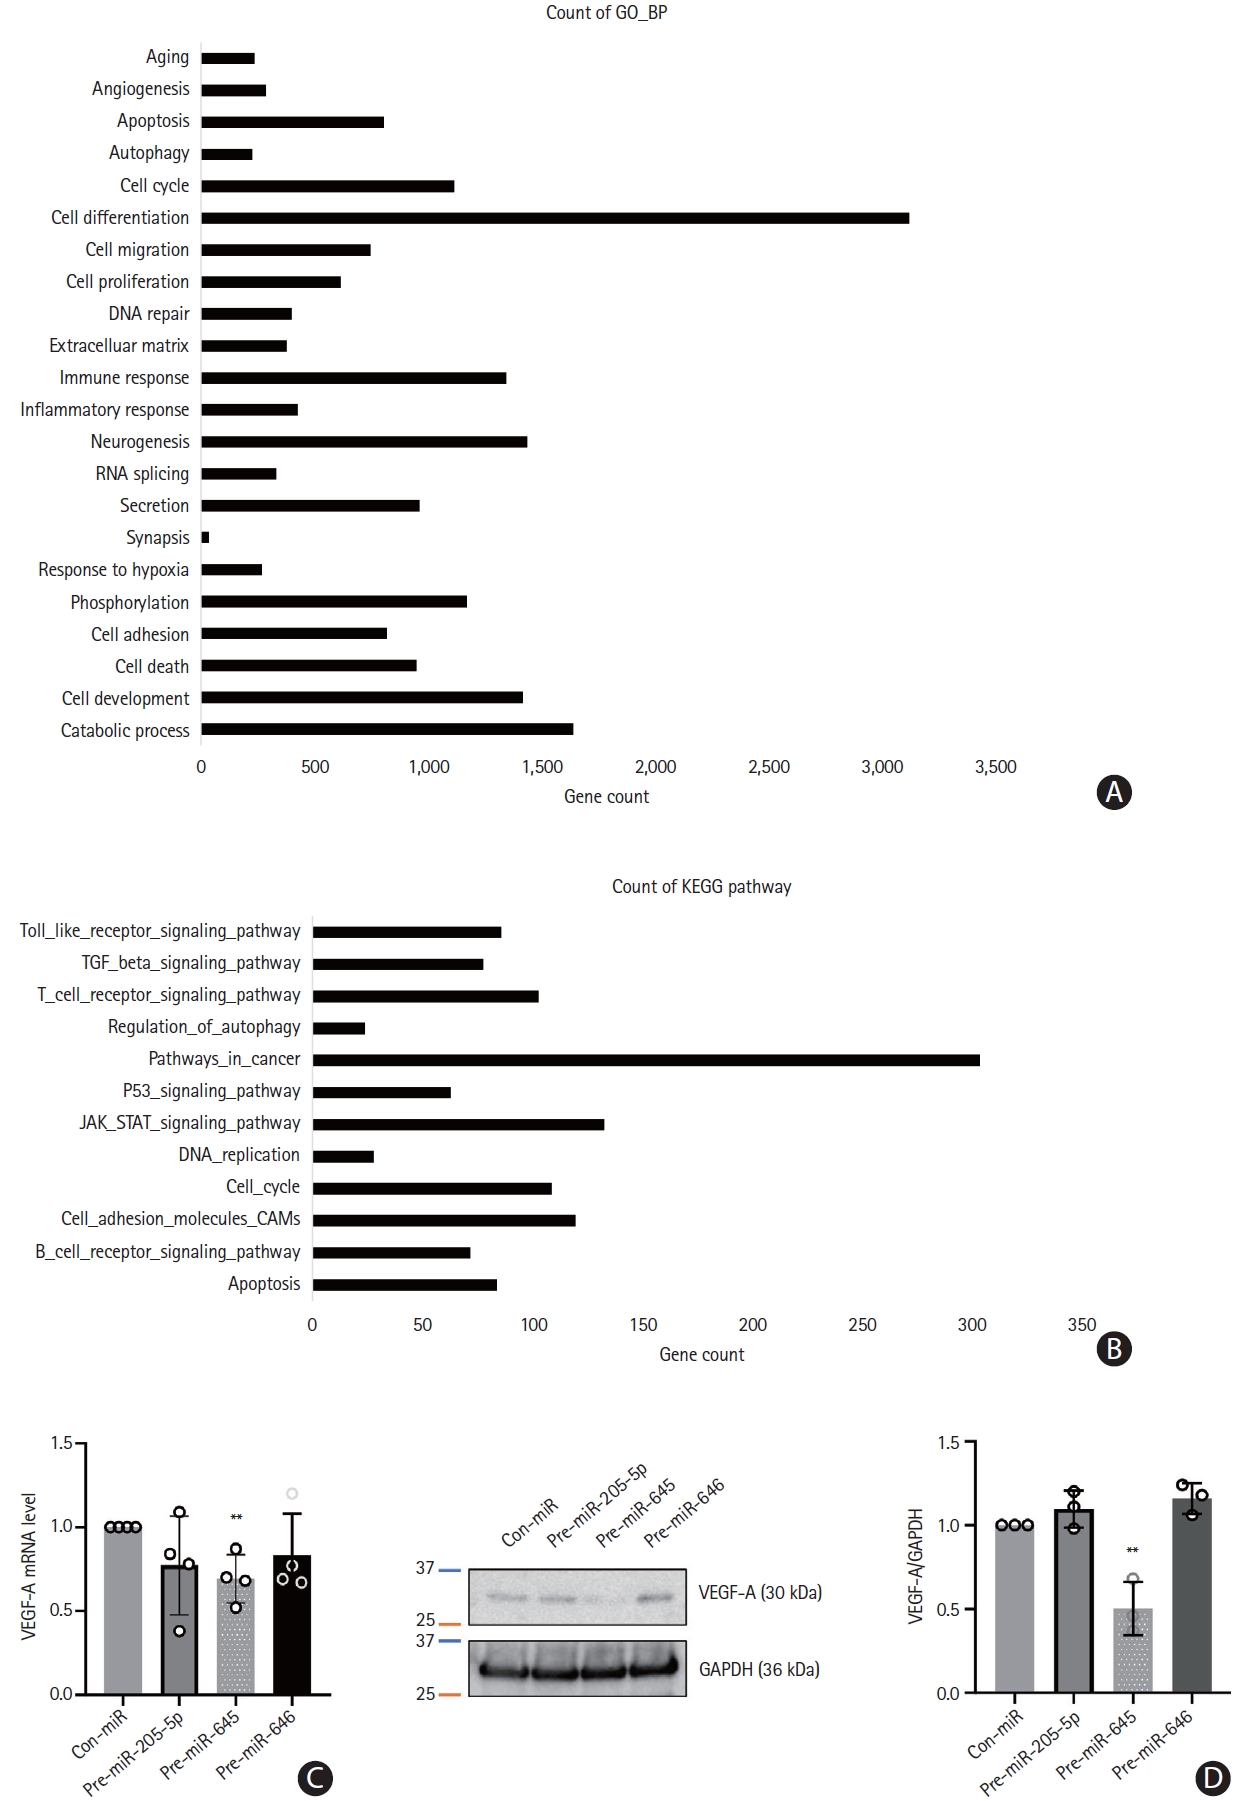
Gene Ontology (GO) and Kyoto Encyclopedia of Genes and Genomes (KEGG) functional analysis and target gene validation. (A and B) GO of biological processes and KEGG pathways presented using the 10 most relevant terms for target genes of microRNAs enriched in microvesicles. (C) Human umbilical vein endothelial cells (HUVEC) were transfected with control microRNA (con-miR) or three microRNA mimics (for microRNA overexpression) respectively. The level of vascular endothelial growth factor A (VEGF-A) mRNA was assessed through quantitative real-time polymerase chain reaction (qRT-PCR) analysis. Data were presented with mean ± standard deviation. Statistical analyses were performed using Student’s t-test in three independent experiments (**P<0.01). (D) Western blot analysis was performed to evaluate the expression level of VEGF-A in HUVEC. Glyceraldehyde-3-phosphate dehydrogenase (GAPDH) was used as a loading control. Quantification of image were performed with ImageJ program and statistical analysis were presented by Student’s t-test (**P<0.01).
In addition, we investigated whether microvesicle-miRNAs are associated with the development of coagulopathy (as measured by D-dimer levels) and NETosis (as measured by plasma DNA and nucleosome). The elevated miRNA levels, especially miR-205-5p, were associated with elevated D-dimer levels, but no significant correlation was found between microvesicle-miRNA levels and NETosis markers (Supplementary Table 3).
Lastly, we investigated whether the injection of miR-205-5p causes the development of thrombosis in an animal model (n=5 per group) of carotid artery thrombosis (Figure 8). Systemic injection of miR-205-5p promoted the development of arterial thrombosis as measured by occlusion time on laser Duplex and histological analysis (Figure 8B). The plasma levels of D-dimer measured by ELISA were increased after the injection of miR-205-5p.
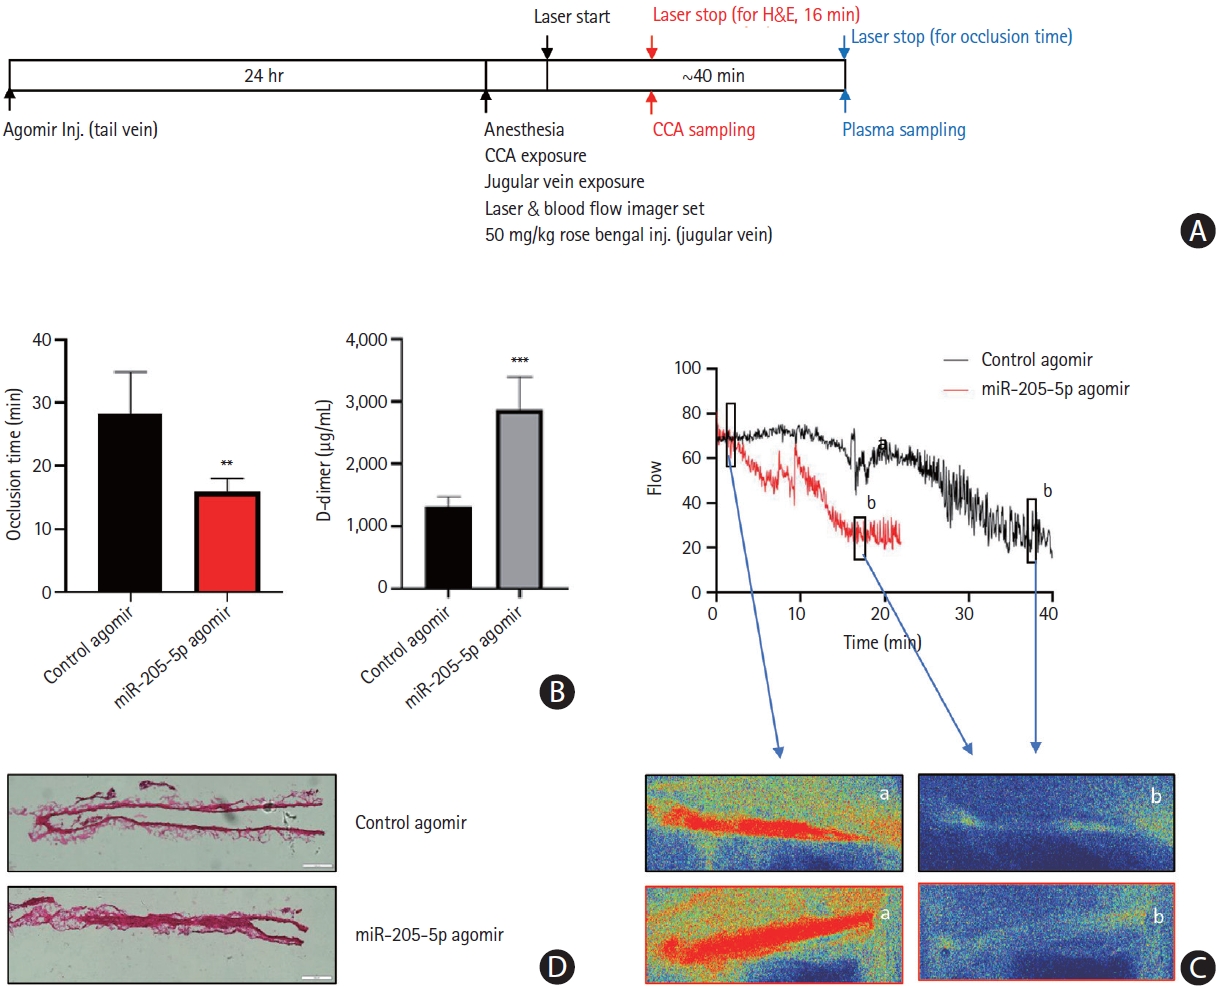
The effect of miR-205-5p in a mouse model of carotid artery thrombosis. (A) The scheme of in vivo common carotid artery (CCA) thrombosis. (B) Occlusion time of the common carotid arteries and the plasma levels of D-dimer in the control agomir- or hsa-miR-205-5p agomir-treated mice (n=5 per group). Data are presented as mean±standard deviation. **P<0.01, ***P<0.001 vs. control agomir. (C) Representative blood flow curve and laser speckle image in control agomir- or hsa-miR-205-5p agomir-treated mice. The laser was exposed on the common carotid artery (a) followed by common carotid artery occlusion (b). (D) Hematoxylin and eosin (H&E) staining of transverse section of common carotid artery in agomir-treated mice.
Discussion
Evaluation of EVs from patients with cancer-stroke revealed that miR-205-5p, miR-645, and miR-646 were specifically incorporated into microvesicles in patients with cancer-related stroke compared with those with cancer alone or stroke alone. In addition, miRNA profiling has diagnostic value in predicting stroke in patients with cancer, although further studies are needed for the underlying mechanisms of these miRNAs in the development of coagulopathy. To the best of our knowledge, no study has yet investigated the dysregulated expression of EV-incorporated miRNAs in patients with cancer who had stroke due to cancer-associated coagulopathy.
In clinical practice, differentiation of patients with cancer-related stroke and those with cancer-unrelated strokes is important. Appropriate anticoagulation with low-molecular-weight heparin is the mainstay of treatment for cancer-related stroke. A long-term follow-up study of 268 patients with cancer-stroke reported that effective correction of hypercoagulability through appropriate anticoagulation was associated with increased survival after adjusting for stroke severity, cancer type, and the presence of metastasis [17]. Identification of patients with cancer-related stroke based on EV-miRNA profiles could guide appropriate evaluation of hidden malignancies and treatment of cancer-associated coagulopathy. On the other hand, it is important to identify the presence of coagulopathy in cancer patients, as stroke causes severe disability in patients with cancer and the use of anticoagulants can effectively prevent thrombotic events.
In this study, we investigated the miRNA profiles of plasma exosomes and microvesicles. We have previously shown that circulating cancer cell-derived EV levels are elevated in patients with cancer-stroke and are associated with coagulopathy and infarct volume [18,19]. It is also reported that cancer cells secrete more microvesicles than normal cells [20], and patients with cancer have higher levels of circulating microvesicles compared with healthy individuals [21,22]. Chen et al. [23] analyzed miRNA profiles of microvesicles and exosomes secreted from cancer cell lines and showed distinct miRNA signatures for microvesicles and exosomes, probably because of the selective distribution of cellular miRNAs into EVs. Manri et al. [24] used size-sorted EVs and showed that the size-selective harvesting of EVs may be informative for strategic analyses to diagnose cancers. The relatively larger particles precipitated by PEG5k clearly exhibited the greatest amount of epithelial cell adhesion molecule (EpCAM) from both breast and colon cancer cells, and a larger quantity of miRNA specific to breast cancer cells (miR-155 for MCF-7) was contained in the polyethylene glycol (PEG)-precipitated particles. In addition, our data showed that microvesicles contain biologically significant amounts of miRNAs and are a more reliable source of miRNA biomarkers compared to exosomes. Furthermore, the miRNA profile of microvesicles differs from that of exosomes, with the exception of miR-623.
Current methods available for individual miRNA expression studies have limitations in the quantification of EV-miRNAs. For instance, conventional qRT-PCR-based miRNA detection method can be used to quantify the absolute copy numbers of target miRNAs. However, this method is based on the relative quantification of miRNA copies that fit the standard curve of Ct values of a known internal or reference control. We measured EV-miRNA levels and normalized with C. elegans miR-39 to minimize the possible bias in the measurement of miRNAs [10]. With the use of digital PCR methods for absolute quantification, miRNA quantification can be performed without standard curve fitting, and target miRNAs can be directly quantified with precision by determining the number of digital PCR replicates. However, most digital PCR methods have a limitation in performing multiplex detection (e.g., simultaneous detection of many target miRNAs from more than 50 different samples). Therefore, we applied a new method using miRNA-specific nanosensors that directly recognize target miRNAs, which can be further subjected to Oxford Nanopore Technology (ONT)-mediated sequencing. This method offers a more reliable quantification of target miRNAs in many samples (more than 50 samples) simultaneously compared with other miRNA detection methods. This is because it counts the copy numbers of target miRNAs based on sequencing. Hence, our results (i.e., the copy numbers of three different target miRNAs in the microvesicles from 75 individuals) are reliable.
In the present study, three miRNAs showed diagnostic potential in our patient cohort. The levels of plasma microvesicle-incorporated miR-205, miR-645, and miR-646 were found to be increased in patients with cancer-stroke compared to cancercontrols, and they could differentiate between patients with cancer-related stroke and those with cancer-unrelated stroke. Interestingly, few miRNAs in the present study overlap with those reported in previous studies of cancer-associated miRNA changes. This discrepancy is likely due to the fact that different sample types (i.e., whole plasma, exosomes, and microvesicles) and cancer types (mostly lung adenocarcinoma in the present study) were analyzed. The profile of EV-miRNAs may vary depending on the cancer type; for instance, miR-205 is upregulated in lung cancer, but downregulated in breast cancer [25,26]. In addition, difference in the sample type from which EVs are derived (i.e., plasma or serum) and methodological differences in EV isolation, miRNA profiling, and expression normalization could be important caveats when comparing the results of different studies [10]. In the present study, we used plasma as recommended by the International Society of Extracellular Vesicles (ISEVs), because platelets release EVs in serum during clot formation, accounting for >50% of EVs in the serum [27]. Studies have investigated the role of miR-205-5p, miR-645, or miR-646 in the occurrence and progression of diverse cancers. However, the role of these miRNAs in cancer-associated coagulopathy has not been studied. Several studies have suggested that dysregulated miR-205-5p, miR-645, or miR-646 is positively correlated with the pathogenesis of cancer, indicating that miR-205-5p, miR-645, or miR-646 might play an important role in cancer. Gao et al. [28] showed that miR-205-5p was significantly upregulated in the serum of patients with stroke and silencing miR-205-5p promoted angiogenesis. Although EV-miRNA levels were not reported, upregulated miR-645 expression in tissue samples from patients with non-small cell lung cancer, head and neck cancer, and colon cancer was reported to be associated with worse outcome [29-31]. Studies have reported that miR-646 inhibits the proliferation of nonsmall cell lung cancer and laryngeal cancer [32,33].
Our results of in vivo study suggest the possibility of a direct role of miRNAs in the development of arterial thrombosis. However, further studies are needed to understand underlying mechanisms related to EV-miRNAs-mediated thrombosis. In the present study, target gene prediction and bioinformatics analysis were performed because miRNAs have huge functional networks that cover multiple genes. The target genes of these dysregulated miRNAs were associated with pathways in cancer, the JAK/STAT signaling pathway, cell adhesion molecules, and cell cycle. Previous and our present studies showed that miR-205-5p and miR-645 directly bind to the 3’-untranslated region (UTR) of VEGF-A and negatively regulate VEGF-A expression [34]. Anti-VEGF agents have been approved as anti-cancer therapies, but concerns have arisen regarding the risk of thromboembolic events related to disruption of endothelial cell function, interaction with tissue factor, the primary initiator of blood coagulation, and increased expression of pro-inflammatory cytokines [35].
A number of prothrombotic mechanisms have been proposed to explain cancer-associated thrombosis, which include the initiation of the extrinsic pathway by clotting initiator protein (tissue factor) and polyphosphate (polyP) in circulating tumor-derived EVs and interaction of tumor-derived EVs with platelets or neutrophils (NET release) [36]. The contribution of EVs to cancer coagulopathy is quite complex, involving one or more mechanisms in a certain cancer type [36]. In this study, we evaluated the correlation between miRNAs and EV-linked molecules such as NETosis markers derived from other cancer cells. Our results showed a lack of association between microvesicle-miRNA and D-dimer and NETosis markers, which suggests that although microvesicle-miRNAs have diagnostic value in patients with stroke, other EV-related mechanisms may be involved in the development of cancer-associated coagulopathy [37].
This study had several limitations. First, the sample size of the patient cohort was relatively small. Most patients with cancer have lung cancer, especially adenocarcinoma. Because of the retrospective design and limited sample size and cancer type, caution needs to be exercised when generalizing the results. Further studies with a larger cohort involving various cancer types are required. In addition, serial measurements of EV-miRNAs and long-term follow-up of patients with cancer are required to validate the role of EV-miRNAs in cancer-associated coagulopathy. Second, we did not analyze miRNA profiles of EV-depleted plasma, which merits further study. However, Endzelin´ š et al. [38] reported that EV-incorporated miRNA levels, but not whole plasma miRNA levels, could distinguish patients with cancer with different histological characteristics, suggesting that EVs could offer a more reliable source of RNA than whole plasma. Third, microvesicle-miRNA levels may change with time after stroke onset and the use of anticoagulants. In this study, serial miRNA levels were measured after anticoagulation therapy in six patients. Although the D-dimer level was dramatically decreased after treatment with enoxaparin (from 32.4±21.8 to 3.86±1.45 mg/dL), the levels of total microvesicle RNA (pretreatment 311.4±37.2 mg/mL and posttreatment 287.5±32.5 mg/mL) and miRNAs were not decreased after treatment (normalized values to pretreatment level: 0.72±0.77 mg/mL for miR-205-5p, 2.09±2.79 mg/mL for miR645, and 5,466±13,388 mg/mL for miR-646). Recurrent stroke was observed in two patients, and miRNAs levels were stable, unlike D-dimer levels (Supplementary Figure 3). Fourth, several cell types of the brain and circulation release EVs into the blood during stroke, but the source of EVs/miRNAs were not evaluated in this study. Further studies are needed to evaluate the source of EVs and EV-miRNAs. Finally, clinical and imaging characteristics of patients, including cancer treatment, were not included in the analysis because of the small cohort size. In addition, future studies merit multiple biomarkers (including, EV proteins) to determine whether the use of a combination of biomarkers can improve the prediction of cancer-associated coagulopathy because the contribution of EVs to cancer coagulopathy could be complex.
Conclusions
In conclusion, EV-miRNAs, in particular microvesicle-incorporated miR-205-5p, miR-645, and miR-646, are potential biomarkers for predicting cancer-associated coagulopathies such as cancerrelated stroke. Further prospective studies are required to investigate whether the levels of miRNAs are associated with neurological outcome or recurrence and whether optimal anticoagulation can prevent cancer-associated coagulopathy in patients with cancer and elevated levels of these miRNAs. In addition, therapeutic strategies against these miRNAs should be evaluated further.
Supplementary materials
Supplementary materials related to this article can be found online at https://doi.org/10.5853/jos.2022.02327.
Baseline characteristics of developing cohort
Baseline characteristics of validation cohort
Laboratory findings depending on the miR-205-5p levels among stroke patients (cancer-stroke and stroke-control)
Patients’ selection.
The numbers of (A) plasma microvesicles (MVs) and (B) exosome (EX) were measured in cancer controls (n=5), stroke controls (n=5), and cancer stroke (n=10) patients, using the nanoparticle tracking analysis (NTA). (C) The changes in the number of plasma MVs prior and after anticoagulation therapy in cancer stroke patients (n=6). NTA showed no changes in the number of MVs with the use of anticoagulation (7.16±6.88×10⁸ vs. 25.87±35.51×10⁸, P=0.3608). EV, extracellular vessicle.
Effects of anticoagulation therapy in the levels of microvesicle incorporated microRNAs (miRNAs). (A) Serial miRNA changes. (B) Changes in D-dimer (mg/dL) and microvesicle-incorporated miRNAs in two patients with cancer-stroke who had stroke recurrence during the course of anticoagulation. While D-dimer levels dramatically changed with the use of anticoagulation, miRNA levels were not changed significantly.
Notes
Funding statement
This study was supported by the National Research Foundation of Korea grant (no. 2022R1A2C209148111). S&E bio Co., Ltd. provided support for this study in the form of salaries for E.H.K. and G.S.O. The funders had no role in study design, data collection and analysis, decision to publish, or preparation of the manuscript.
Conflicts of interest
The authors have no financial conflicts of interest.
Author contribution
Conceptualization: OYB. Study design: OYB, EHK. Methodology: OYB, EHK, SWY. Data collection: OYB, JWC, WKS, GMK, MJA. Investigation: EHK, MJO, JY, GSO, SWY. Statistical analysis: OYB, EHK. Writing—original draft: OYB, EHK, SWY. Writing—review & editing: OYB, EHK. Funding acquisition: OYB. Approval of final manuscript: all authors.
Acknowledgements
The authors thank Min-Ji Kim, Biomedical Statistics Center, Research Institute for Future Medicine, Samsung Medical Center, and Hyeon Ho Kim, PhD, Department of Health Sciences and Technology, Samsung Advanced Institute for Health Sciences and Technology, for their assistance in the data analysis.