Cost-Effectiveness of Endovascular Thrombectomy in Childhood Stroke: An Analysis of the Save ChildS Study
Article information
 , Peter B. Spornsb,c,*, Marios N. Psychogiosb, Jens Fiehlerc, René Chapotd, Franziska Dorne, Astrid Gramsf, Andrea Morottig, Patricia Musolinoh, Sarah Leei, André Kemmlingj, Hans Henkesk, Omid Nikoubashmanl, Martin Wiesmannl, Ulf Jensen-Konderingm, Markus Möhlenbruchn, Marc Schlamanno, Wolfgang Marikp, Stefan Schobq, Christina Wendlr, Bernd Turowskis, Friedrich Götzt, Daniel Kaiseru, Konstantinos Dimitriadisv, Alexandra Gersingw, Thomas Liebigw, Jens Rickea, Paul Reidlera, Moritz Wildgrubera,†, Sebastian Möncha,†, for the Save ChildS Investigators
Abstract
Background and Purpose
The Save ChildS Study demonstrated that endovascular thrombectomy (EVT) is a safe treatment option for pediatric stroke patients with large vessel occlusions (LVOs) with high recanalization rates. Our aim was to determine the long-term cost, health consequences and cost-effectiveness of EVT in this patient population.
Methods
In this retrospective study, a decision-analytic Markov model estimated lifetime costs and quality-adjusted life years (QALYs). Early outcome parameters were based on the entire Save ChildS Study to model the EVT group. As no randomized data exist, the Save ChildS patient subgroup with unsuccessful recanalization was used to model the standard of care group. For modeling of lifetime estimates, pediatric and adult input parameters were obtained from the current literature. The analysis was conducted in a United States setting applying healthcare and societal perspectives. Probabilistic sensitivity analyses were performed. The willingness-to-pay threshold was set to $100,000 per QALY.
Results
The model results yielded EVT as the dominant (cost-effective as well as cost-saving) strategy for pediatric stroke patients. The incremental effectiveness for the average age of 11.3 years at first stroke in the Save ChildS Study was determined as an additional 4.02 lifetime QALYs, with lifetime cost-savings that amounted to $169,982 from a healthcare perspective and $254,110 when applying a societal perspective. Acceptability rates for EVT were 96.60% and 96.66% for the healthcare and societal perspectives.
Conclusions
EVT for pediatric stroke patients with LVOs resulted in added QALY and reduced lifetime costs. Based on the available data in the Save ChildS Study, EVT is very likely to be a cost-effective treatment strategy for childhood stroke.
Introduction
Ischemic stroke ranks among the most cost-intensive diseases in all Western countries. Its currently estimated direct and indirect annual costs in the United States are $50 billion [1]. For patients with acute anterior circulation large vessel occlusions (LVO), randomized controlled trials (RCTs) established endovascular thrombectomy (EVT) as standard of care (SC) for adults [2]. The widespread adoption has been supported and accelerated by several economic analyses, demonstrating EVT to be long-term cost-saving for healthcare systems across many different countries [3-7].
Pediatric arterial ischemic stroke differs vastly from adult stroke in prevalence, etiology, risk factors, symptoms, and neurologic outcome [8]. The SC is largely based on supportive care. The evidence on efficacy and safety of intravenous thrombolysis remains scarce after the Thrombolysis in Pediatric Stroke (TIPS) trial was closed for lack of accrual [9,10]. In recent years, severe strokes in children with LVO are increasingly being treated with EVT in specialized centers [11]. The Save ChildS Study demonstrated that EVT is a safe and effective treatment option for pediatric stroke patients and that a favorable outcome similar to EVT in adults can be achieved [12].
Pediatric patients represent a demographic group with a low incidence of stroke yet suffer the longest consequences of potential disability. Pediatric stroke is thereby linked to substantial direct healthcare costs in the first year, yet few reports exist on the long-term care costs [13] Given the longer remaining lifespan in children, pediatric stroke also influences indirect costs, e.g., as a result of reduced lifetime productivity and need for informal care by next of kin [14].
Our study aim was to determine the long-term cost and health consequences as well as cost-effectiveness of EVT in this patient population.
Methods
Ethics statement
The present study complies with the principles of the Declaration of Helsinki (1964). The present study was approved by the Institutional Review Board, and the requirement for written informed consent was waived. All of our patient population was previously reported in the Save ChildS Study [12].
Model structure
A decision model using dedicated analytic software (TreeAge Pro 2021 version 21.1.0, TreeAge, Williamstown, MA, USA) was applied to evaluate the cost-effectiveness of EVT versus SC. Adhering to the recommendations by the Second Panel on Cost-Effectiveness in Health and Medicine [14]. We performed analyses adopting the healthcare as well as a societal perspective. A short-run model was created to analyze costs and functional outcomes within the initial 90 days after the index stroke. Pediatric stroke patients with LVO enter the model on admission to the hospital, receive either EVT or SC and afterwards enter one of the seven health states according to the degree of disability as assessed by the modified Rankin Scale (mRS).
A long-run Markov state transition model was used to estimate the expected costs and outcomes over the lifetime of the patient, using a cycle length of 1 year. During each cycle, patients could either remain in the same health state, experience a recurrent stroke and recover to the same mRS state or transit to a lower mRS state, or die from other causes. Absorbing states were death due to stroke or death due to any other cause. The model structure is shown in Figure 1.
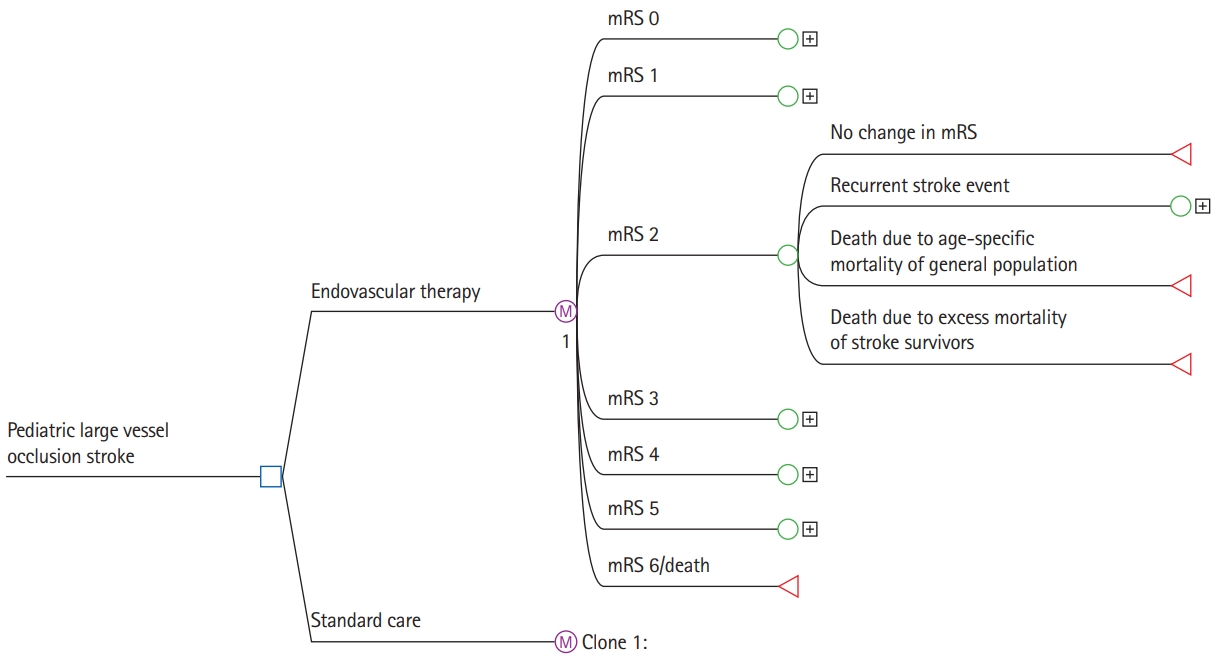
Model structure. mRS, modified Rankin Scale.
Model input parameters
The input parameters for the model were based on the most recently published literature providing the best available level of evidence (Table 1) [2,7,15-37]. To study the impact of patient age, we based this study on a dedicated systematic and comprehensive literature review regarding age dependency of model input parameters [38].

Base-case values and sources of model input parameters
Initial and transition probabilities
The initial probabilities (i.e., the probability of entering a specific mRS health state at hospital discharge) were based on outcomes in the Save ChildS Study [12]. This multicenter trial included 73 children from 27 participating stroke centers. There is no randomized data on the use of EVT versus SC in children. Following careful interdisciplinary discussion among the study coordinators, the best approach to model outcomes for the SC group was considered to be based on the Save ChildS study subgroup with unsuccessful recanalization (modified Thrombolysis in Cerebral Infarction [mTICI] 0–2a). The outcome parameters of the entire Save ChildS Study population were used to model the EVT group, i.e., any recanalization status (mTICI 0–3). The mRS outcomes for both subgroups are provided in Figure 2.
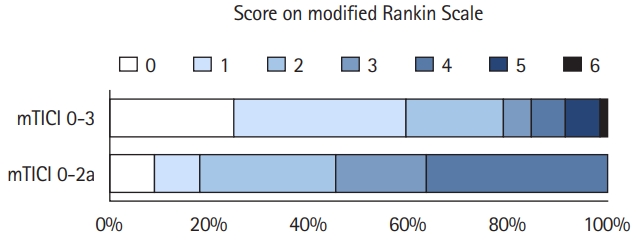
Save ChildS Study outcomes by recanalization grade. Pediatric stroke outcomes on the modified Rankin Scale during hospital discharge stratified by modified Thrombolysis in Cerebral Infarction (mTICI) scores. The mTICI 0–3 group represents all patients in the Save ChildS study and was used to model outcomes of the thrombectomy group. The mTICI 0–2a group represents patients with unsuccessful recanalization; these outcomes were used to model the standard of care group.
The transition probabilities consisted of the probability of staying in the same health state, the annual recurrent stroke rate, the probabilities of reentering the same or a lower health state following recurrent stroke, and the age-specific annual death rate. Based on several long-term follow-up studies on functional recovery after stroke, we assumed no significant mRS change in the long-term after stroke [15-17]. The pediatric recurrent stroke rate was obtained from a long-term follow-up study of childhood stroke [39]. The adult recurrent stroke rate is known to decrease over time after the index stroke and to increase with patient age; corresponding rates were available from a contemporary long-term study in adults [18]. Both aspects were built into the model. The age-specific annual death rate was drawn from the United States Life Table [19]. The death rate was adjusted according to adult hazard rate ratios for each of the mRS health states [20], which are considered to be age-independent [20]. The probabilities to reenter the health states following a recurrent stroke were approximated for both arms using age-dependent resampling of the initial probabilities of the Save ChildS Study and in case of adult recurrent stroke following the according age subgroup receiving SC in a meta-analysis on LVO in adult patients, a conservative assumption based on literature review [18,40-42].
Direct costs
Both direct acute and long-term costs were stratified for each of the seven health states (mRS levels 0–6). The acute treatment costs in the first 90 days were based on a study that determined the implied costs for each mRS score in adults [21]. The costs for EVT and SC were added to the acute treatment costs within 90 days according to the specific strategy. Based on studies that investigated the material usage, procedure times and recanalization rates, we assumed that the EVT procedure costs are independent of patient age [30,31].
The long-term annual treatment costs were based on contemporary data from the United States for each level of the mRS score [7]. In line with the literature, the acute and long-term costs were not adjusted for patient age [22-29]. All costs were converted to 2020 United States Dollars according to the medical care component of the Consumer Price Index [43] and discounted by 3% each year [14].
Indirect costs
To adopt a societal perspective, we assessed the indirect costs caused by childhood stroke based on the human capital approach. According to this approach, the amount of the productivity losses is measured based on (1) the lost productivity due to premature mortality in stroke patients; (2) the reduced productivity that is caused by the morbidity of stroke survivors; and (3) the costs for informal caregiving by next of kin [14].
To analyze the costs caused by premature mortality (1), we used age-dependent productivity measures based on nationwide average gross wages of the employed population. Gross wage data were available for citizens from 16 years up to 80 years of age by the United States Census Bureau (Current Population Survey) [44]. These productivity measures were combined with the general population employment status provided by the United States Bureau of Labor Statistics [45]. Non-stroke-related deaths were not considered for premature mortality.
To model the costs implied by the reduced productivity of stroke survivors (2), we multiplied the above-mentioned productivity measures by the relative earnings of stroke survivors compared to the non-stroke population (82.5%) [46]. To our knowledge, there is no data that represent the relative earnings depending on the functional disability as measured on the mRS scale. As there is consensus on the fact that the patient’s level of disability is the most important predictor of return-to-work (RTW) [47], we used the functional outcome as an alternative approach as previously described [47]. We multiplied each above-mentioned productivity measure by the RTW probability of stroke survivors, respective of their current level of disability and calculated the difference to the annual earnings of a healthy age-matched individual. We used reported RTW probabilities stratified by individual mRS health states (mRS 0, 0.63; mRS 1, 0.72; mRS 2, 0.49; mRS 3, 0.19; mRS 4, 0.14; mRS 5, 0.00) [48]. RTW was shown to be mainly influenced by the degree of disability than by patient age [49,50].
The annual costs for informal caregiving (3) were based on estimates for the United States [51] and stratified by degrees of disability (mRS 0–1 vs. mRS 2–5). The hourly wages for home health aides in the United States of the recently reported year 2018 were used to calculate annual costs. These additional input parameters to model the societal perspective are provided in Table 1.
Utilities
Therapy effectiveness was measured by quality-adjusted life years (QALYs), calculated by multiplying years spent in mRS health states by assigned utility weights. Utility weights were derived from a recent survey that used a patient-centered approach [33]. In line with several studies on health-related quality of life after ischemic stroke, patient age was assumed to have no significant influence on the utility weights [34-37]. Values range from 0.0 to 1.0, with 0.0 representing no, and 1.0 representing perfect quality of life. All QALYs were discounted by 3% each year [14].
Cost-effectiveness analysis
Treatment strategies were compared in terms of incremental costs, incremental effectiveness and incremental cost-effectiveness ratios. In line with recent recommendations [14,52], we applied different willingness-to-pay (WTP) thresholds ($50,000, $100,000, and $150,000 per QALY). Cost-effectiveness acceptability rates were determined for different patient ages.
Sensitivity analysis
To test the robustness of the model, we conducted probabilistic sensitivity analyses, allowing for simultaneous alteration of multiple model input parameters. The starting age was set to the median age in the Save ChildS Study of 11.3 years. Distribution types were used according to probability density functions for 2nd order Monte Carlo simulation runs (n=10,000). The distribution type for the model input parameters is shown in Table 1. To study the impact of the pediatric recurrent stroke rate in the first year after index stroke, deterministic one-way sensitivity analysis was performed.
Results
Probabilistic sensitivity analyses
The model results yielded EVT as the dominant (i.e., cost-effective as well as cost-saving) strategy for pediatric stroke patients. The median cumulative effectiveness over the lifetime was estimated with 20.33 QALYs for EVT treatment and 16.33 QALYs for SC treatment. The median lifetime healthcare costs amounted to $559,212 for EVT treatment and to $729,195 for SC treatment. The incremental effectiveness for the average age of 11.3 years at first stroke in the Save ChildS Study was thus determined as an additional 4.02 lifetime QALYs, with lifetime cost-savings that amounted to $169,982 from a healthcare perspective and $254,110 when applying a societal perspective.
Acceptability rates for EVT were consistently higher than 95% for all tested WTP thresholds and for both perspectives. EVT reached 96.49% and 96.64% acceptability at a WTP of $100,000/QALY for the healthcare and societal perspectives. The detailed results are presented in Table 2. Cost-effectiveness planes showing scatter plots of incremental costs and effectiveness of the 10,000 simulation runs are presented in Figure 3.

Results of probabilistic sensitivity analyses
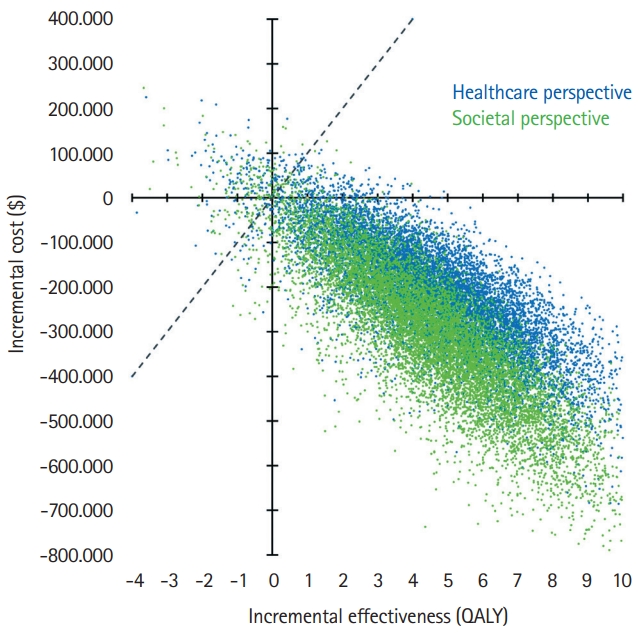
Probabilistic sensitivity analysis from the healthcare and societal perspective. Cost-effectiveness planes of incremental costs and incremental effectiveness of endovascular thrombectomy (EVT) versus standard care are shown for the probabilistic sensitivity analysis. Each dot represents one simulation run. The dashed line indicates a willingness-to-pay threshold of $100,000/quality-adjusted life year (QALY). Dots right to this line are considered cost-effective simulation runs. Dots in the right lower quadrant indicate cost-savings combined with incremental QALYs by EVT.
One-way sensitivity analysis of pediatric recurrent stroke rate
The deterministic one-way sensitivity analysis for first-year recurrent stroke rate yielded cost-effectiveness for EVT even up to a rate of 50%. The lifetime costs remained lower with EVT across the range from 0% to 50% (Figure 4A), while incremental QALYs continually declined as a result of the shortened life expectancy (Figure 4B). Incremental net monetary benefit values remained positive across the range from 0% up to 50% first-year recurrent stroke rate (Figure 4C).

Sensitivity analysis of first-year pediatric recurrent stroke rate. Deterministic one-way sensitivity analysis results are shown for the societal perspective, including societal lifetime costs (A), lifetime quality-adjusted life years (QALYs) (B), and incremental net monetary benefit for endovascular thrombectomy (EVT) compared with standard care (SC) (C). Positive incremental net monetary benefit values indicate cost-effectiveness of EVT based on a willingness-to-pay of $100,000/QALY.
Discussion
Our study systematically investigated the cost-effectiveness of EVT for pediatric patients with LVO stroke. Adopting a United States healthcare as well as a societal perspective, EVT was the dominant strategy, resulting in significant lifetime health benefits and cost-savings compared with conventional SC management. From an economic point of view, there is clear support for EVT as the preferred treatment strategy in this patient population.
While several large prospective randomized trials have shown the clear benefit of EVT in adulthood stroke, making it the SC in acute LVO, only small cohorts have been published investigating the use of EVT in childhood stroke [11,53]. The Save ChildS study was the first multicenter retrospective analysis of the use of EVT for LVO in children, demonstrating technical and clinical success rates comparable to the large RCTs in adults, with a good safety profile. This holds even true for children with LVO presenting in the late therapeutic window of up to 24 hours after onset of symptoms and different age groups [54,55].
As prospective randomized trials on EVT in children will most likely never become available, the evidence level will be based on those retrospective cohorts as well as prospective registry data. Even though there are several borderline indications such as underlying arteriopathies [56], in light of the moderate evidence of intravenous thrombolysis in pediatric LVO [9,10], EVT is increasingly advocated in the pediatric stroke community [57,58].
The major strength of this analysis is a detailed literature re- view regarding age dependency of model input parameters and the modification during the pediatric and adult timeline during the lifetime simulations as well as data access to the largest contemporary cohort on pediatric EVT. Moreover, this study included a healthcare as well as a societal perspective, as currently recommended by the Second Panel on Cost-Effectiveness in Health and Medicine [14].
There are several limitations of our study that need to be taken into account when interpreting the results. First, the study design was retrospective with the inherent limitations of this type of design, for example regarding model input data or change in procedure over time of recruitment. Second, outcomes for EVT and SC had to be modeled based on successful and futile recanalization as no randomized data or respective SC cohort data were available. As the complication rate of EVT is also very low in children, this approach may best model the differences in outcome and has been used before to study EVT treatment effects in large core strokes in adults [59]. Third, it was not feasible to study different pediatric age subgroups based on the limited patient numbers. Fourth, several of the cost input parameters had to be modelled on the basis of adult data as there were no corresponding pediatric data available in the literature. Fifth, mRS was applied as the outcome parameter that defined the different health states. This was also due to a paucity of data on pediatric stroke outcome measures regarding modeling of quality of life and direct as well as indirect costs. Sixth, due to the lack of data for childhood stroke we had to assume that the RTW after stroke was mainly influenced by the mRS outcome, which was only available from a small cohort and had limited data for the mRS 0 subgroup. No data was available to model RTW changes during the process of aging.
Conclusions
In conclusion, our analysis of EVT based on the Save ChildS Study resulted in added QALYs and reduced lifetime costs. Based on the available data, EVT is very likely to be a cost-effective and cost-saving treatment strategy for childhood stroke.
Notes
Disclosure
Jens Fiehler reported serving as a paid consultant for Acandis, Boehringer Ingelheim, Cerenovus, Covidien, Evasc Neurovascular, MD Clinicals, Medtronic, Medina, Microvention, Penumbra, Route92, Stryker, and Transverse Medical. Jens Fiehler is also CEO of Eppdata. Dr Chapot reported receiving personal fees from Microvention, Stryker, Medtronic, Balt, Siemens, and Rapid Medical outside the submitted work. Franziska Dorn received personal fees for consultancy from Acandis, Phenox, Balt, and Cerenovus. Hans Henkes reported receiving personal fees and nonfinancial support from Phenox GmbH during the conduct of the study; in addition, Hans Henkes had patents issued to 10 2004 040 868.8, 200580033578.6, 11/ 678,285, 50 2006 012 111.5, PCT/EP 2005/ 009057, 05 777 177.6-2318, and 10 2005 059 670.3, and is coinventor of several other patents related to thrombectomy. Martin Wiesmann reported receiving grants, personal fees, and nonfinancial support from Stryker Neurovascular; personal fees and nonfinancial support from Medtronic, Penumbra Inc, and Siemens Healthcare; and nonfinancial support from ab medica, Acandis, Asahi Intecc, Cerenovus, Kaneka Pharmaceuticals, Mentice AB, Microvention, and Phenox outside the submitted work. Markus Möhlenbruch reported receiving grants and nonfinancial support from Balt; personal fees from Medtronic; grants, personal fees, and nonfinancial support from MicroVention; and grants and personal fees from Stryker outside the submitted work. Alexander Radbruch reported receiving grants and personal fees from Guerbet and Bayer outside the submitted work. André Kemmling reported receiving personal fees from Penumbra, Stryker, and Phenox outside the submitted work. No industry support of the project was obtained.