


Dear Sir:
Diffusion-weighted imaging (DWI) and perfusion-weighted imaging (PWI) in magnetic resonance imaging (MRI) are used to estimate ischemic core and penumbra volumes in patients with acute ischemic stroke [1]. Core size and target mismatch are important indicators in selecting patients for endovascular thrombectomy (EVT) [2]. However, PWI has several drawbacks such as additional scan time, side effects of gadolinium-based contrast agents, and potential inaccuracy in post-processing [3,4]. Here, we present a method for DWI-alone EVT triage based on machine learning (ML).
The eligibility criterion for inclusion in this study was acute ischemic stroke due to large vessel occlusion within 24┬Āhours from the last known well and available DWI, between January 1, 2011, and December 31, 2019. Demographic information, history of vascular risk factors, initial National Institutes of Health Stroke Scale scores, modified treatment in cerebral infarction (mTICI) scores, 90-day modified Rankin Scale (mRS) scores, and time interval from the last known well to MRI were obtained and compared between the model development and external validation cohorts (Supplementary Table 1). We used prospectively maintained stroke registry databases from the Samsung Medical Center, Korea University Guro Hospital (KUGH), and University of California Los Angeles Medical Center. Each registry was approved by the Institutional Review Board of each center.
MRI scan parameters are provided in Supplementary Table 2, and detailed information on image processing and ML is provided in the Supplementary Methods. Image features included DWI lesion volume [5], lesion sizes in the inner and outer brain regions, and distributions of apparent diffusion coefficient (ADC) ratios (Supplementary Table 3) [6,7]. The features were used as input to ML classifiers. Alternatively, one could consider using deep convolutional neural networks, which learn feature extraction processes from a large training dataset, but we adopted handcrafted features because the size of training data (e.g., the number of patients with unsuccessful recanalization [UR] and the number of patients treated without EVT) was small for deep learning model training.
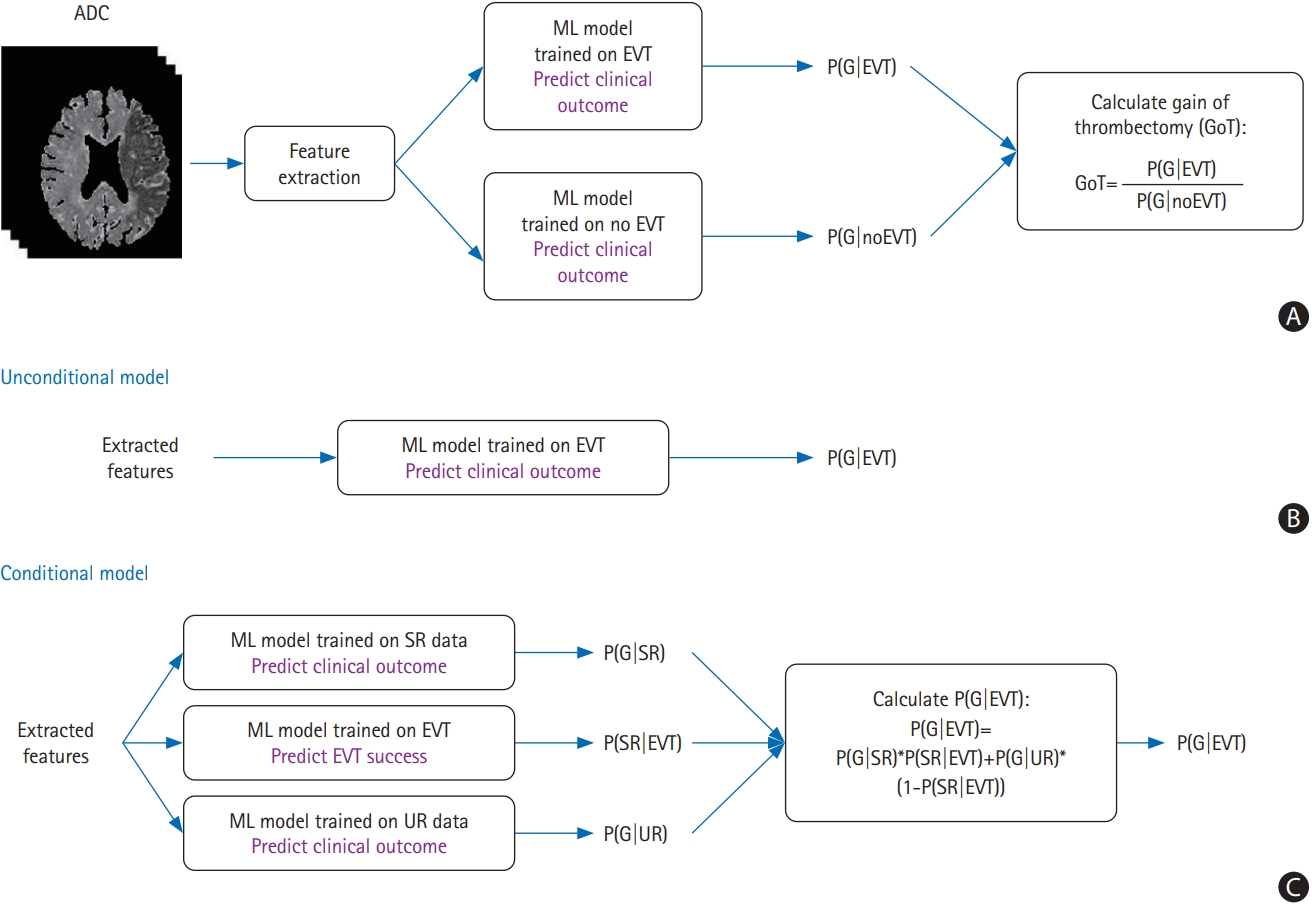
A flowchart of the EVT triage is shown in Figure 1A. As for the criterion of EVT decision, we defined the gain of thrombectomy (GoT) as a likelihood ratio:
Where p(G|EVT) can be further expressed as p(G|EVT)=p(SR|EVT)├Śp(G|SR)+p(UR|EVT)├Śp(G|UR). UR was defined as the mTICI of 0-2a, and successful recanalization (SR) was defined as the mTICI of 2b-3. As shown in Figure 1B and C, we investigated two approaches: (1) calculate p(G|EVT) regardless of any conditions on the success/failure of recanalization, referred to as ŌĆ£unconditionalŌĆØ model; and (2) calculate p(G|EVT) by reflecting the results of p(SR|EVT), p(G|SR), and p(G|UR), referred to as ŌĆ£conditionalŌĆØ model. Cross-validation results demonstrated similar performance in the logistic regression (LR), random forest (RF), and support vector machine (SVM) classifiers, and P(G|UR) showed low mean F1 values (i.e., 0.23 for LR, 0.24 for RF, and 0.18 for SVM), probably because of the inherent difficulty of predicting infarct growth in patients with UR (Supplementary Table 4).
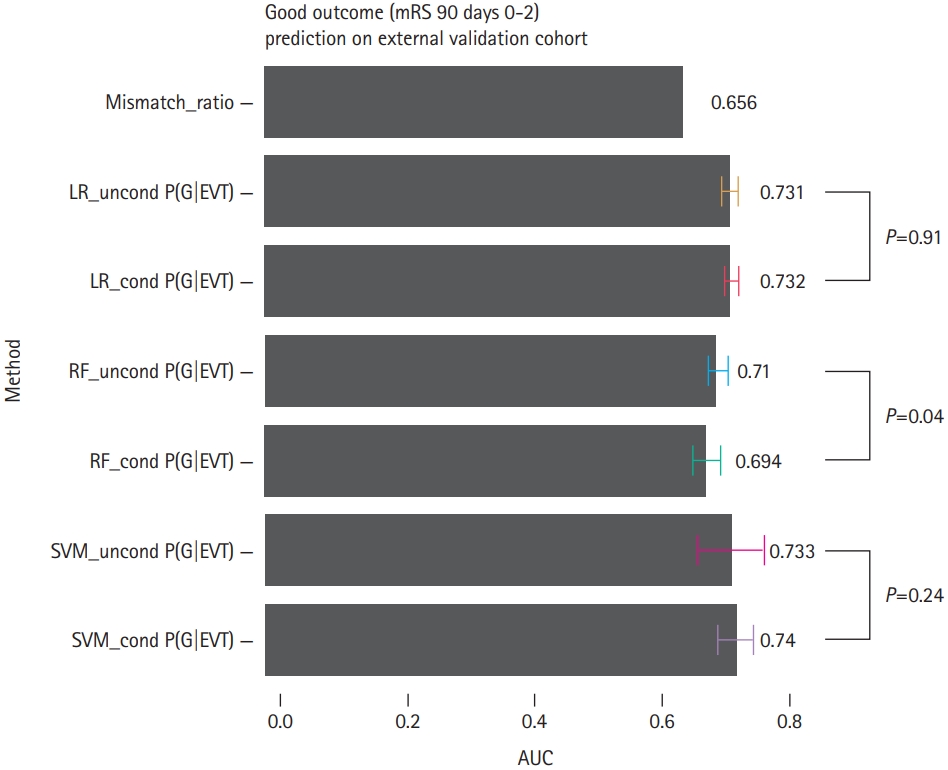
A receiver operating characteristic analysis was performed with a favorable outcome of the mRS score of Ōēż2 at 90┬Ādays as the dependent variable. The external validation of patients with EVT showed that the areas under the curve (AUCs) of favorable outcome prediction with the ML method were higher than those with the PWI-DWI mismatch ratio (AUC=0.656) (Figure 2). The AUCs were not statistically significantly different between the unconditional and conditional models in the LR and SVM classifiers.
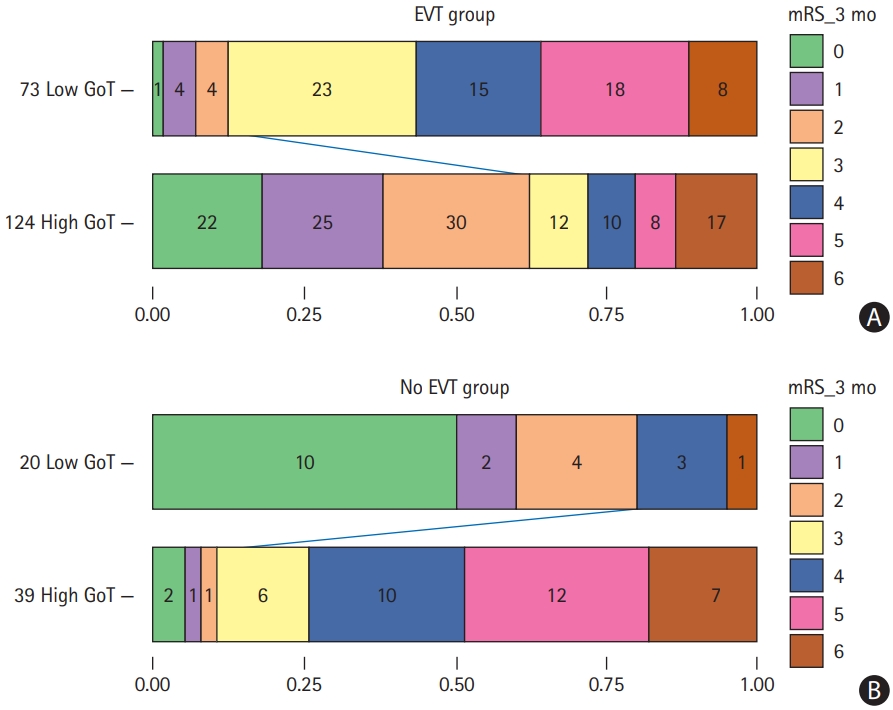
The GoT├ŚEVT interaction in the LR model was statistically significant (P<0.01) in the unadjusted model [8]. We compared the distributions of clinical outcomes between the high and low GoT groups. For the EVT-treated group, the high GoT group showed a larger proportion of low mRS scores than the low GoT group (Figure 3A), indicating that GoT may help predict clinical outcomes prior to treatment. For the no EVT group, the high GoT group showed a smaller proportion of low mRS scores than the low GoT group (Figure 3B).
While this study showed that features extracted from DWI data are robustly predictive of treatment benefit with EVT, additional imaging information could potentially further improve predictive performance. Additional non-perfusion approaches to improve the estimation of P(SR|EVT) include considering imaging features available from either T2*-weighted gradient echo (GRE) images or time-of-flight (TOF) magnetic resonance angiography. Clot characteristics estimated by GRE can help predict the success or failure of reperfusion intervention. Intracranial vessel tortuosity estimated by TOF image analysis would also be helpful in predicting reperfusion success [9].
Our study has limitations. First, the sample size was small, and this was a retrospective study. In particular, the number of no EVT subjects and UR subjects was relatively fewer than that of SR subjects. Second, the development/validation data split was not fully randomized. Data from one institution (KUGH) were only used for model development because the PWI data were not available from KUGH for this study. As such, we could not use the data for external validation in the PWI-DWI mismatch ratio calculation. Third, we did not compare our ML methods with an ML-based method using both DWI and PWI data for feature extraction. Fourth, the presented method is based on image features extracted from ADC maps; however, it does not take into account the temporal dynamics of ADC values. The time interval between symptom onset and MRI scan time may be an important factor in outcome prediction.
In conclusion, we presented an ML-based method that takes features derived from DWI images as input and guides patient selection for EVT. The concept of GoT was introduced for EVT triage based on the predictions of clinical outcomes. Although this is a preliminary study with a small sample size, the presented ML method may have the potential to select patients for EVT and predict clinical outcomes with DWI data alone.