7T Magnetic Resonance Imaging Quantification of Brain Glutamate in Acute Ischaemic Stroke
Article information

Dear Sir:
Glutamate has a role in cellular injury in ischaemic stroke and may be implicated in post-stroke complications, including seizures [1]. Magnetic resonance spectroscopy (MRS) and glutamate weighted chemical exchange saturation transfer (GluCEST) [2] imaging offer non-invasive methods of quantifying brain glutamate levels. Here, we explored the use of 7T MRS and GluCEST to quantify glutamate levels in stroke patients.
We recruited adult patients with radiologically confirmed cortical ischaemic infarct within 14 days of onset. The study was approved by the Melbourne Health Human Research and Ethics Committee (HREC 2017.135) and all patients provided written informed consent.
We recorded clinical characteristics including National Institutes of Health Stroke Scale (NIHSS) score on admission, treatment received, and time from onset to magnetic resonance imaging (MRI). Image acquisition, processing and segmentation were performed according to described methods [3]. The GluCEST acquisition slab was aligned with the axial slice where the infarct was largest, as identified by diffusion-weighted imaging (DWI). Single voxel 1H MRS was performed with a 15×15×15 mm voxel overlapping the 5 mm GluCEST slice, and a contralateral mirror reference voxel. GluCEST regions of interest (ROI) included the ischaemic lesion, a mirror ROI in the contralateral hemisphere, and MRS voxel locations. Averaged GluCEST contrast intensity for each ROI was quantified as percent contrast intensity. MRS data was analysed using LCModel [4]. Glutamate concentration, scaled to water, was calculated in mmol/L. An ipsilateral to contralateral ratio was calculated for MRS glutamate concentration and GluCEST contrast.
Statistical analysis was performed using GraphPad Prism version 7.00 for Windows (GraphPad Software, San Diego, CA, USA). Paired T-tests compared MRS concentrations and Glu- CEST contrast between hemispheres. Independent T-tests compared ratios between patients. P<0.05 denoted a significant result. GluCEST contrast and glutamate concentration within voxels were compared by linear regression. Correlation between concentration ratio and both NIHSS and time to MRI was analysed with Pearson’s (or, if nonparametric, Spearman’s) correlation.
Nineteen patients participated (Table 1). MRI scans were performed between 2 and 13 days after stroke onset. Eleven patients underwent both GluCEST and MRS, seven underwent GluCEST only and one patient MRS only. Three patients were subsequently excluded from the GluCEST analysis due to artefact from haemorrhagic transformation. Overall, MRS glutamate concentration was lower in the ipsilateral than contralateral hemisphere (mean difference, standard deviation [SD] 1.97±1.70 mmol/L; P=0.002), and numerically lower in 11/12 patients. There was no difference between ipsilateral and contralateral GluCEST contrast (mean difference, SD 0.61±2.19; P=0.30), with ipsilateral GluCEST contrast higher in 3/15 patients, lower in 9, and similar (ratio 0.8 to 1.2) in 3. Figure 1 shows DWI and GluCEST images from patients 8 and 11. Those with higher GluCEST contrast had all presented with high NIHSS on admission (Table 1), and 2/3 had high final infarct volumes. Across the population however there was no significant correlation between NIHSS and glutamate concentration ratio (R=0.11, P=0.74 for MRS; Spearman’s Rho=0.31, P=0.26 for GluCEST). There was no correlation between MRS concentration ratio (ipsilateral divided by contralateral) and time to MRI (R=0.25, P=0.43). Concentration ratio did not differ according to whether treatment was received (mean concentration ratio 0.67 vs. 0.62, P=0.80). There was a significant but modest correlation between MRS glutamate concentration and GluCEST contrast across all ROI (R=0.50, P=0.018).
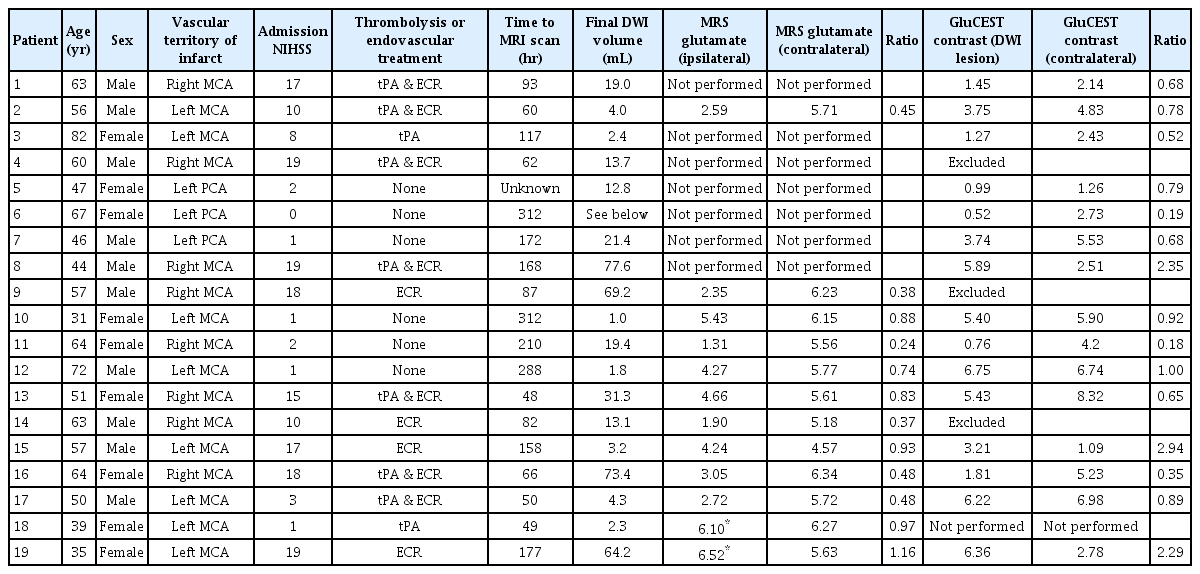
Clinical characteristics of the study population
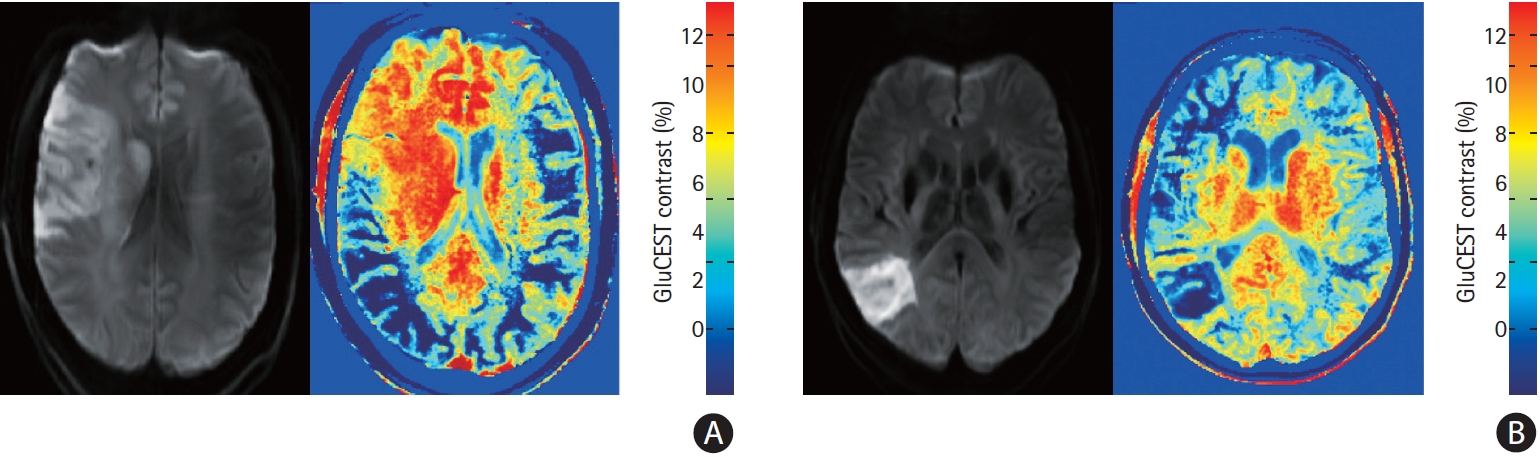
Diffusion weighted imaging and chemical exchange saturation transfer (CEST) images from patient 8 (A) and patient 11 (B) demonstrating regionally increased and decreased glutamate weighted chemical exchange saturation transfer (GluCEST) contrast ipsilateral to the infarction. The asymmetry in GluCEST contrast in regions distant to the infarction may be due to brain positioning asymmetry.
Using 7T MRI, we observed decreased MRS glutamate concentration ipsilateral to stroke and a more heterogeneous pattern of GluCEST contrast suggestive of both increased and decreased glutamate concentrations within the population. The highest GluCEST contrast ratios were seen in those with more severe strokes, consistent with dysregulation of glutamate homeostasis.
A previous 3T MRS study [5] found no difference in glutamate concentration between ipsilateral and contralateral hemispheres, although voxels were placed in perilesional tissue and scans were performed at 24 hours. Our scans are likely to have occurred after the peak in glutamate concentration [6], and animal studies observing relatively lower MRS glutamate concentrations have cited the inability of MRS to differentiate between intracellular and extracellular glutamate [7]. GluCEST contrast may also be affected by pH [2], with tissue acidosis possibly contributing to increased contrast in two patients with large strokes. Our study limitations include small sample size, clinical heterogeneity, and variability of time to MRI. A consecutive series was not recruited, potentially biasing the population toward those with milder strokes. B0 and B1 artefacts are recognised technical limitations of 7T MRI and nuclear Overhauser effect can result in negative CEST contrast [8]. GluCEST signal is only appreciable at high field strengths, limiting its translation to clinical practice until access to 7T is more widely available outside the research setting.
Further research may include use of newer imaging techniques to rapidly acquire 3-dimensional CEST images [9], allowing coverage of greater brain regions and combination with sequences to define the revascularised penumbra, where glutamate may be increased due to oxidative stress. Methods of correcting for B0 artefact in the setting of stroke are also emerging [10]. Further study is required to delineate the effects of infarct size, reperfusion, and time to scan acquisition as determinants of brain glutamate concentration.
Acknowledgements
This research was funded by a grant from the Brain Foundation, Australia. In conducting this research, John-Paul Nicolo was supported by an Australian Government Research Training Program Scholarship.
We acknowledge the facilities, and the scientific and technical assistance of the Australian National Imaging Facility and at the Melbourne Brain Centre Imaging Unit. This work was supported by a research collaboration agreement with Siemens Healthineers.