Automated Prediction of Ischemic Brain Tissue Fate from Multiphase Computed Tomographic Angiography in Patients with Acute Ischemic Stroke Using Machine Learning
Article information

Abstract
Background and Purpose
Multiphase computed tomographic angiography (mCTA) provides time variant images of pial vasculature supplying brain in patients with acute ischemic stroke (AIS). To develop a machine learning (ML) technique to predict tissue perfusion and infarction from mCTA source images.
Methods
284 patients with AIS were included from the Precise and Rapid assessment of collaterals using multi-phase CTA in the triage of patients with acute ischemic stroke for Intra-artery Therapy (Prove-IT) study. All patients had non-contrast computed tomography, mCTA, and computed tomographic perfusion (CTP) at baseline and follow-up magnetic resonance imaging/non-contrast-enhanced computed tomography. Of the 284 patient images, 140 patient images were randomly selected to train and validate three ML models to predict a pre-defined Tmax thresholded perfusion abnormality, core and penumbra on CTP. The remaining 144 patient images were used to test the ML models. The predicted perfusion, core and penumbra lesions from ML models were compared to CTP perfusion lesion and to follow-up infarct using Bland-Altman plots, concordance correlation coefficient (CCC), intra-class correlation coefficient (ICC), and Dice similarity coefficient.
Results
Mean difference between the mCTA predicted perfusion volume and CTP perfusion volume was 4.6 mL (limit of agreement [LoA], –53 to 62.1 mL; P=0.56; CCC 0.63 [95% confidence interval [CI], 0.53 to 0.71; P<0.01], ICC 0.68 [95% CI, 0.58 to 0.78; P<0.001]). Mean difference between the mCTA predicted infarct and follow-up infarct in the 100 patients with acute reperfusion (modified thrombolysis in cerebral infarction [mTICI] 2b/2c/3) was 21.7 mL, while it was 3.4 mL in the 44 patients not achieving reperfusion (mTICI 0/1). Amongst reperfused subjects, CCC was 0.4 (95% CI, 0.15 to 0.55; P<0.01) and ICC was 0.42 (95% CI, 0.18 to 0.50; P<0.01); in non-reperfused subjects CCC was 0.52 (95% CI, 0.20 to 0.60; P<0.001) and ICC was 0.60 (95% CI, 0.37 to 0.76; P<0.001). No difference was observed between the mCTA and CTP predicted infarct volume in the test cohort (P=0.67).
Conclusions
A ML based mCTA model is able to predict brain tissue perfusion abnormality and follow-up infarction, comparable to CTP.
Introduction
Infarct predicted using computed tomographic perfusion (CTP) at admission is often used in treatment decision making in patients with acute ischemic stroke (AIS) [1-4]. CTP classifies core (predicted infarction) and penumbra using tissue perfusion estimates derived using a deconvolution algorithm from serial imaging of the brain. The mismatch ratio between salvageable tissue (penumbra) volume and core volume is used for selecting patients presenting beyond 6 hours and up to 24 hours from last known well [3]. Although widely used, CTP has longer acquisition times and consequent susceptibility to patient motion, concerns about radiation dose and limited z axis coverage, especially with some older scanners [5-8]. Multiphase computed tomographic angiography (mCTA) is an alternative imaging technique that has been similarly used to select patients with AIS for endovascular therapy (EVT) in recent clinical trials [9,10]. It generates whole brain time-resolved (three phases) images of pial arteries and veins beyond an occlusion while also determining thrombus location, size, vessel patency and tortuosity [11,12]. mCTA has a simpler image acquisition protocol, lower radiation exposure and less need for intravenous contrast in spite of its requirements for expertise to interpret when compared to a CTP based acute stroke imaging protocol [11]. Due to its limited temporal resolution however, this technique has not been used to predict ischemic tissue fate on a voxel-by-voxel basis, in the same way as CTP imaging is used. Recent studies however show that mCTA can be used to semi-quantitatively predict tissue fate at a regional level, similar to CTP [13-15]. An ability to harness the advantages of mCTA while producing brain maps that estimate tissue perfusion and predict tissue fate like CTP is likely to be of significant clinical utility.
We therefore aim to develop a machine learning (ML) based technique to estimate brain tissue perfusion abnormality and predict core and penumbra similar to what CTP does in patients with AIS.
Methods
Data were from the Precise and Rapid assessment of collaterals using multi-phase CTA in the triage of patients with acute ischemic stroke for Intra-artery Therapy (Prove-IT) study [11,13], a multicenter study that acquired acute multimodal CT imaging including non-contrast-enhanced computed tomography (NCCT), mCTA imaging (three phases), and CTP at baseline among ischemic stroke patients [11,13]. This study was approved by the local Institutional Review Board. Written informed consent by the patients was waived due to a retrospective nature of our study.
Study participants
Subjects who had (1) baseline NCCT and mCTA; (2) baseline CTP imaging with ≥8 cm z axis coverage; (3) had reperfusion assessed on conventional angiography after thrombolysis treatment (intravenous tissue plasminogen activator, EVT, or both) with the modified thrombolysis in cerebral infarction [mTICI]); and (4) had 24/36-hour follow-up imaging on diffusion magnetic resonance imaging or NCCT were included in this analysis. Patient inclusion and exclusion are shown in Figure 1. We included 284 patients, of whom, 196 patients had acute reperfusion (mTICI 2b/2c/3) and 88 patients did not (mTICI 0/1).
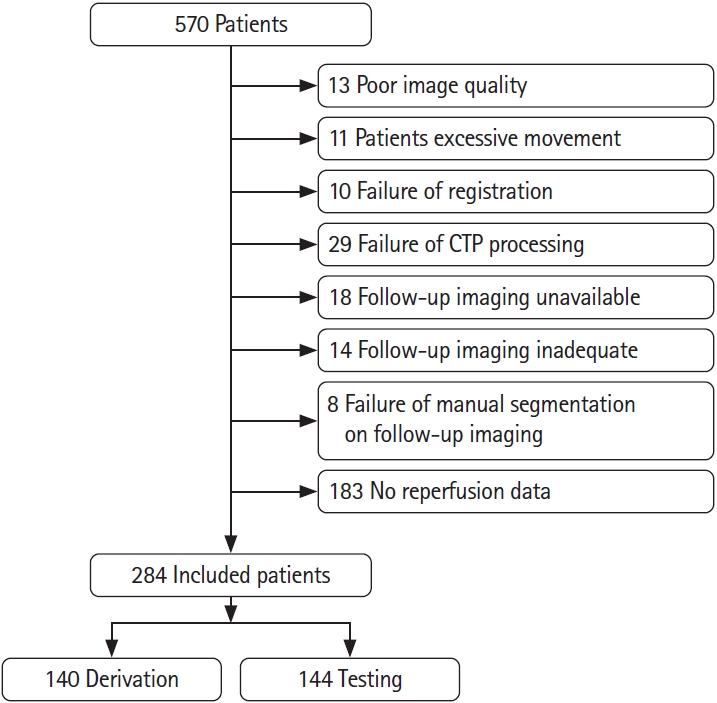
Patient inclusion chart. CTP, computed tomographic perfusion.
Imaging protocol
NCCT and mCTA
NCCT with 5 mm slice thickness was obtained, followed by mCTA with arch to vertex coverage in the first (arterial) and skull base to vertex coverage the second (peak venous) and third (late venous) phase. Detailed mCTA acquisition parameters have been published previously [11]. Axial images with 1 mm overlap and multiplanar axial, coronal, and sagittal reconstructions with 3 mm thickness, 1 mm intervals and 1 mm overlap for the first phase were obtained, along with axial maximum intensity projections for all three phases with 24 mm thickness and 4 mm intervals.
CTP
Iodinated contrast agent 45 mL were injected at a rate of 4.5 mL/sec followed by a 40 mL saline bolus injected at a rate of 6 mL/sec. Image acquisition started 5 seconds after contrast injection and 24 passes over 66 seconds were performed with 5 mm section thickness and a cranio-caudal coverage of 8 cm.
Image preprocessing
Each CTP study was processed using commercially available delay-insensitive deconvolution software (CT Perfusion 4D, GE Healthcare, Waukesha, WI, USA). Absolute maps of cerebral blood flow (mL/min/100 g), cerebral blood volume (mL/100 g), and Tmax (seconds) were generated. Average maps were created by averaging the dynamic CTP source images. Time-dependent Tmax thresholds confirmed previously (Supplementary Table 1), were used to generate baseline CTP thresholded maps (perfusion volume) [6-8].
NCCT and mCTA images were first skull stripped [16]. Three phase computed tomographic angiography (CTA) images were then aligned using rigid-body registration to account for patient movement. The aligned 3-phase CTA images were registered onto NCCT images using affine registration. Two radiologists (>5 years’ experience) used ITK-SNAP (http://www.itksnap.org) and consensus to manually delineate the infarct region on follow-up diffusion-weighted imaging (DWI)/NCCT imaging [17]. The follow-up images along with manual infarct segmentations and CTP average maps were registered onto NCCT images, thus bringing all images into the same image space. When registration was sub-optimal, manual refinement of the registered infarct segmentations was attempted. The NiftyReg tool was used for all image registration tasks [18].
Machine learning model
The perfusion map used in this analysis was a Tmax map thresholded using previously published time-dependent thresholds [6-8]. We defined core as tissue that is infarcted on follow-up imaging even with successful reperfusion (defined as mTICI score 2b/3). Penumbra was defined as ischemic tissue that is not infarct core but infarcts on follow-up imaging when reperfusion is not achieved (mTICI score 0–1) [6,19,20].
We developed three ML models: (1) core model; (2) penumbra model; (3) perfusion model. A 2-stage training mechanism was developed to train two ML models to predict core and penumbra respectively. The detailed training and testing strategy is shown in Figure 2. Of 88 patients without acute reperfusion (mTICI 0/1), 44 patients (35 for training and nine for internal validation) were randomly selected to derive a random forest classifier at the first stage for prediction of follow-up infarction in the non-reperfused patients (penumbra model), while the remaining 44 patients were used to test this derived penumbra model. Of the 196 patients who achieved reperfusion (mTICI 2b/2c/3), 96 patient images (70 for training and 26 for internal validation) randomly selected were first processed by the 1st stage penumbra model, generating penumbra probability maps. These probability maps along with mCTA images were then used as inputs to derive the second random forest classifier at the second stage for infarct prediction (core model) using follow-up infarct manually segmented as reference standard, while the remaining 100 patients were used to test the derived core model. The final predictions are shown as core and penumbra where penumbra is affected tissue from the penumbra model minus affected tissue from the infarct core model (Figure 3).

Training and testing strategy of machine learning models to predict core, penumbra and perfusion status. (A) Derivation and testing of penumbra model and infarction model using follow-up infarct as reference standard. (B) Derivation and testing of the perfusion model using time-dependent Tmax thresholded map as reference standard. mCTA, multiphase computed tomographic angiography.
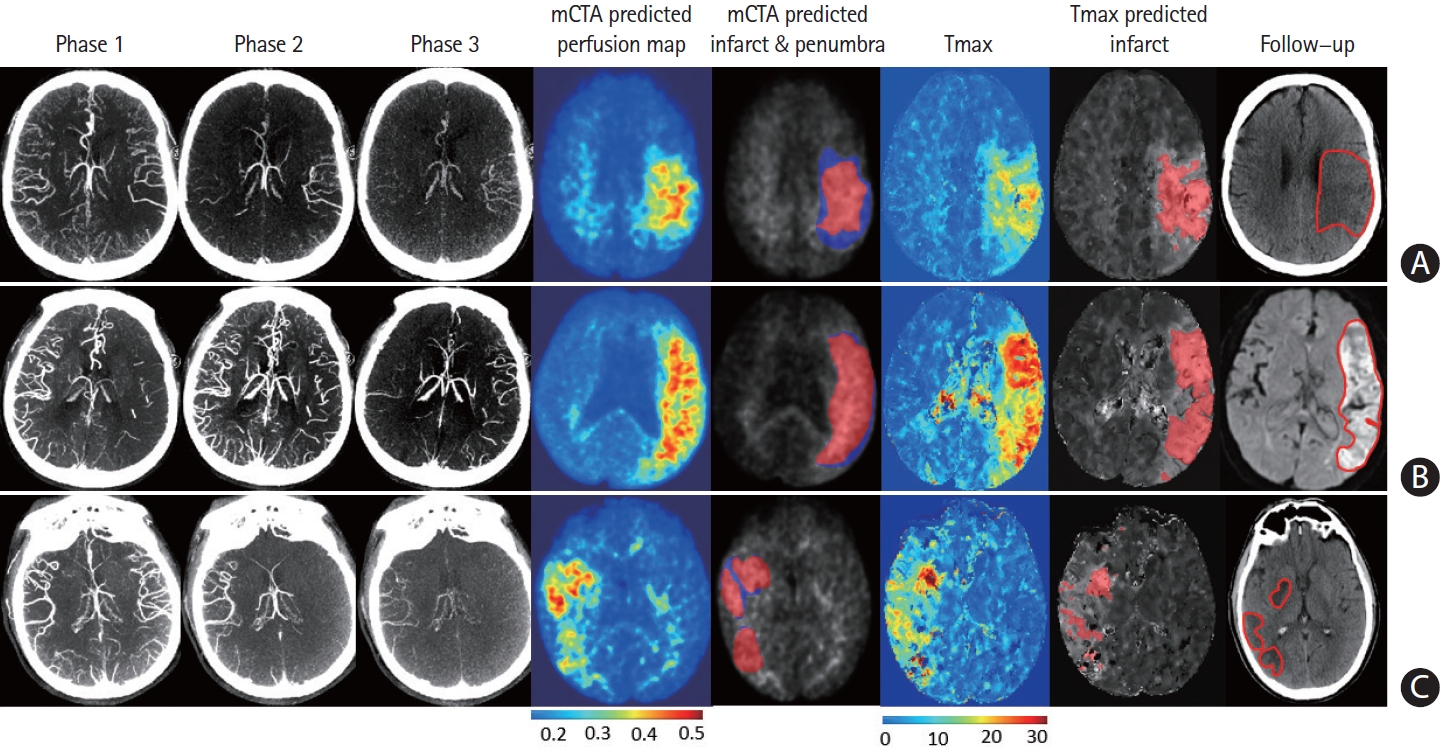
Multiphase computed tomographic angiography (mCTA) predicted infarct map compared to computed tomographic perfusion (CTP) time-dependent Tmax thresholded map when compared to follow-up infarct. (A) Patient who achieved reperfusion (modified thrombolysis in cerebral infarction [mTICI] 2b), (B) patient who did not achieve reperfusion, and (C) patient who achieved reperfusion (mTICI 3). Columns: mCTA phase 1 to 3, mCTA predicted perfusion maps, mCTA predicted core (red in column 5) and penumbra (blue in column 5) overlaid on the mCTA predicted perfusion map, CTP Tmax maps, CTP time-dependent Tmax threshold predicted infarct, infarct contoured in follow-up imaging, respectively. The penumbra is shown as affected tissue from the penumbra model minus affected tissue from the core model.
Further, the 140 patient images used for training and internally validating the penumbra and core models were reused to train and internally validate the third random forest classifier (perfusion model). For deriving and testing this model, time-dependent Tmax thresholded maps from CTP were used as reference standard [6-8]. The 144 images used for testing the penumbra and core models were also used to test the perfusion model.
All three random forest models shared the same self-designed features as inputs. NCCT Hounsfield units (HU) values were first subtracted from 3-phase CTA images, leading to a 3-point time intensity curve (TIC) for each voxel. Several features were extracted from the TIC for each voxel and used for deriving and testing the three random forest classifiers. These were: (1) average and standard deviation of HUs across 3-phase CTA images; (2) coefficient of variance of HUs in 3-phase CTA images; (3) changing slopes of HUs between any two phases; (4) peak of HUs in 3-phase CTA images; (5) time of peak HU. All these features were calculated in the neighborhood centered at each voxel at three scales (3×3×3, 7×7×7, and 11×11×11 voxels) and then normalized using z-score method. The hyper-parameters for each random forest model, such as the number of trees in the forest and the maximum depth of trees, etc., were optimized using 5-fold cross validation using the respective validation cohort. Class weight was set to account for the imbalanced sample distribution based on the ratio of positive and negative samples. The random forest classifiers derived from the training and internal validation dataset was then applied to the test cohort to generate a probability map for each patient. The probability map was then thresholded by a fixed value of 0.35 (determined from the validation cohort), followed by isolated island removal and morphological operation, to generate the mCTA predicted volume.
Statistical methods
T test for normally distributed data, Fisher’s exact test for categorical data and the Rank sum test for non-normally distributed data was used to analyze any differences between groups. Time-dependent Tmax thresholded volumes (CTP volume) were used as reference standard to evaluate the mCTA predicted perfusion volume in the test cohort [6,8]. Expert contoured follow- up infarct volume were used as reference standard to evaluate mCTA predicted core and penumbra volume in the test cohort. Bland-Altman plots were used to illustrate mean differences and limit of agreement (LoA) between mCTA predicted and reference standard volumes. Literal and relative volume agreement between mCTA predicted and reference standard volumes were also assessed using concordance correlation coefficient (CCC) (Appendix 1) and intra-class correlation coefficient (ICC) (Appendix 1), respectively. Spatial agreement between mCTA predicted lesion and reference standard was assessed using Dice similarity coefficient (DSC) (Appendix 1). All statistical analyses were performed using MedCalc version 17.8 (MedCalc Software, Mariakerke, Belgium) and MATLAB R2018a (The MathWorks Inc., Natick, MA, USA). A two-sided alpha <0.05 was considered as statistically significant.
Results
Study participants
Patient characteristics are summarized in Table 1. No differences were observed between the derivation and test cohorts (all P>0.05). Patient characteristics in patients with mTICI 2b/3 and 0/1 are summarized in Supplementary Table 2.

Patient characteristics in the derivation and test cohorts in the study
Accuracy of mCTA in predicting tissue perfusion status
Figure 4A illustrates a Bland-Altman plot showing agreement between the mCTA predicted perfusion volume and pre-specified CTP Tmax thresholded perfusion volume for 144 patients in the entire test cohort. The mean difference between the mCTA perfusion volume (median, 40.5 mL; interquartile range [IQR], 22.9 to 59) and CTP volume (median, 26.9 mL; IQR, 6.7 to56.7) was 4.6 mL (LoA, –53 to 62.1; P=0.56), CCC was 0.63 (95% confidence interval [CI], 0.53 to 0.71; P<0.01) and ICC was 0.68 (95% CI, 0.58 to 0.78; P<0.001). The median DSC between mCTA predicted perfusion and CTP perfusion was 40.5% (IQR, 25.7% to 52.7%).
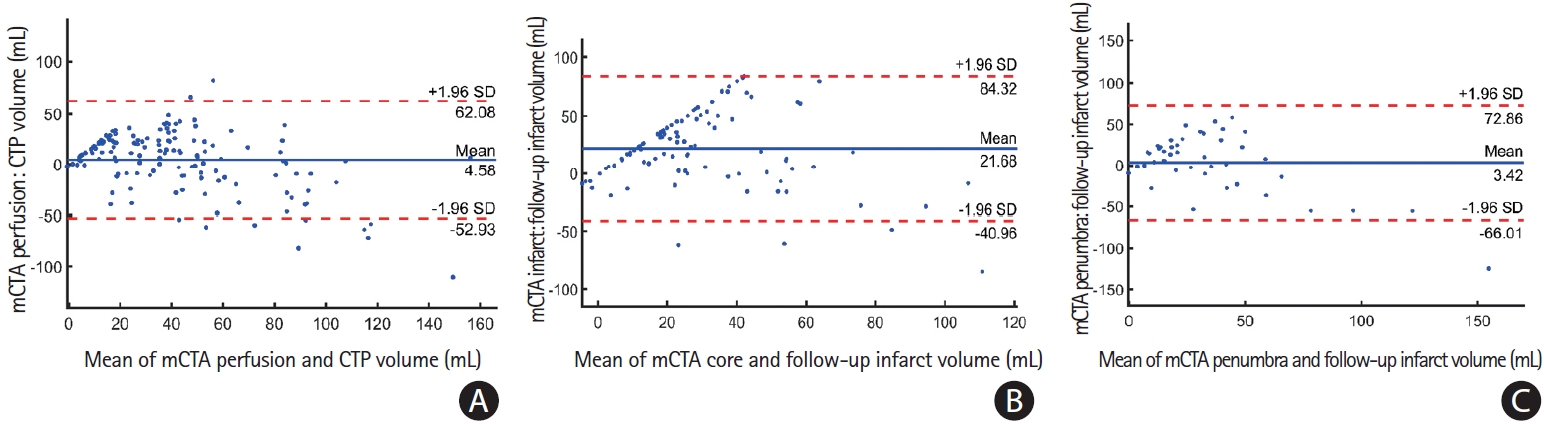
Bland-Altman plots of (A) multiphase computed tomographic angiography (mCTA) infarct volume predicted using the penumbra model versus follow-up infarct volume for the 44 patients who did not achieve acute reperfusion; (B) mCTA infarct volume predicted using core model versus follow-up infarct volume for the 100 patients who achieved reperfusion; and (C) mCTA perfusion volume predicted using perfusion model versus time-dependent Tmax predicted infarct volume for all 144 patients in the test cohort. CTP, computed tomographic perfusion; SD, standard deviation.
Accuracy of mCTA in predicting follow-up infarction
Figure 4B illustrates a Bland-Altman plot between mCTA predicted infarct volume and follow-up infarct volume in the 44 patients who did not receive acute reperfusion (mTICI 0/1) in the test cohort. The mean difference between this mCTA predicted infarct volume (median, 33.2 mL; IQR, 20.6 to 53.2) and follow-up infarct volume (median, 26.8 mL; IQR, 12.3 to 54.8) was 3.4 mL (LoA, –66 to 72.9; P=0.69). The CCC between the two volumes was 0.52 (95% CI, 0.20 to 0.60; P<0.001) while the ICC was 0.60 (95% CI, 0.37 to 0.76; P<0.001). The median DSC between the mCTA predicted infarct and follow-up infarct was 26.5% (IQR, 12.9% to 39.3%).
Figure 4C illustrates a Bland-Altman agreement between the mCTA predicted core volume and follow-up volume for 100 patients who achieved acute reperfusion (mTICI 2b/2c/3) in the test cohort. The mean difference between the mCTA predicted core volume (median, 37 mL; IQR, 23 to 58) and follow-up volume (median, 26 mL; IQR, 13 to 54) was 21.7 mL (LoA, –41.0 to 84.3; P=0.48), CCC was 0.4 (95% CI, 0.15 to 0.55; P<0.01) and ICC 0.42 (95% CI, 0.18 to 0.50; P<0.01). The median DSC between the mCTA predicted core and follow- up infarct was 24.7% (IQR, 13.8% to 30.4%).
Comparing mCTA machine learning models to CTP in predicting follow-up infarction
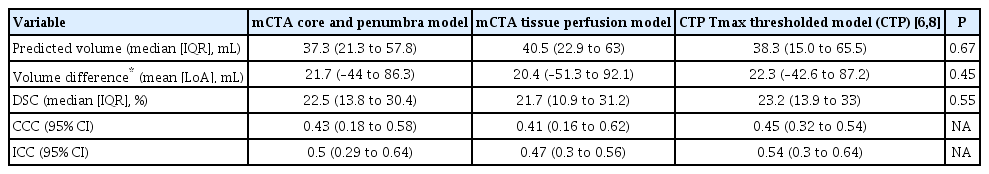
Infarct volumes predicted by the mCTA models and those by CTP versus the reference standard (follow-up infarct volume) in the test cohort (n=144) are shown in Table 2 and showed no statistically significant differences for any measure (all P>0.05). CCC and ICC for the core model, mCTA penumbra model, and time-dependent Tmax thresholding predicted volumes compared to follow-up infarct volume between 136 patients with anterior circulation (internal carotid artery, middle cerebral artery, and anterior cerebral artery) and eight patients with posterior circulation (vertebral and basilar) occlusions are summarized in Supplementary Table 3.
Discussion
mCTA with its simple three phase image acquisition protocol is a quick and easy-to-implement imaging tool used in patients with AIS [11]. The ML technique described in this study shows that tissue perfusion status can be automatically estimated from the mCTA, a technique with limited temporal resolution, just as it is currently done using CTP imaging that has a much higher temporal resolution. In addition, the mCTA ML models described in this study are able to predict tissue fate in patients with AIS similar to what current CTP techniques can do [6-8]. The mCTA ML models could therefore help support physicians in making clinical decisions regarding acute stroke treatment, especially in hospitals without CTP capabilities.
Imaging paradigms currently used for selecting patients with AIS for treatment include non-contrast CT, single-phase CTA, or CTP. Although CTP is widely used in large comprehensive stroke centers, its adoption in smaller, less academic hospitals and in primary stroke centers continues to be limited. Concerns about technical expertise needed for its implementation and, the additional radiation and contrast needed when compared to a stroke protocol based on NCCT and single-phase CTA limit its acceptability in smaller hospitals. CTP is also sensitive to patient motion, a feature that invalidates that tool in almost 10 to 25% of patients [21]. As an example, eleven patients were excluded from this study as CTP maps generated by the software were corrupted due to excessive patient motion during acquisition (Figure 5). mCTA is a simple extension (two additional phases) of single-phase CTA that is used as standard care in all hospitals imaging patients with acute stroke. It therefore has whole brain coverage, involves no additional use of intravenous contrast, involves very limited radiation increase and is less prone to patient motion [12,13,16]. It has been used in clinical trials such as The Endovascular Treatment for Small Core and Anterior Circulation Proximal Occlusion with Emphasis on Minimizing CT to Recanalization Times (ESCAPE) and ESCAPE NA1 to select patients for EVT [22,23]. ML models such as those developed in this study have the potential to harness these advantages of mCTA while generating tissue perfusion and tissue fate prediction maps similar to CTP; thus, potentially increasing physician confidence in decision making in hospitals that currently do not do CTP. Of note, unlike conventional mCTA but similar to CTP, the technique described in this study is capable of detecting smaller perfusion lesions in the entire brain including the posterior circulation (Figure 6).
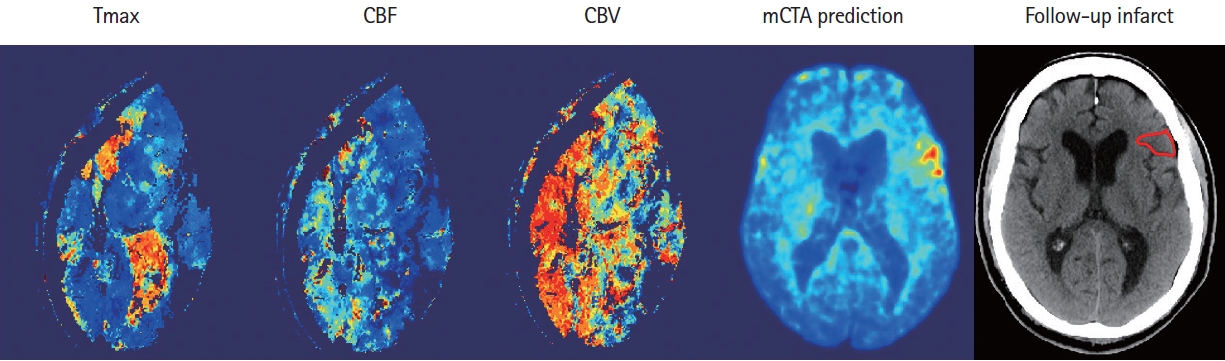
An example shows the computed tomographic perfusion (CTP) maps (column 1–3) due to the excessive movement of the patient during CTP acquisition, versus multiphase computed tomographic angiography (mCTA) prediction (column 4) that correlates well with follow-up imaging (column 5). CBF, cerebral blood flow; CBV, cerebral blood volume.

An example shows the multiphase computed tomographic angiography (mCTA) prediction, computed tomographic perfusion map, and follow-up imaging of a patient with posterior circulation occlusion.
A strength of the developed ML technique is that it does not rely on deconvolution algorithms, which plays an essential role in current CTP processing. Although deconvolution methods can appropriately model perfusion status, the introduction of physiological variations in arterial delivery of contrast, the effects of collateral flow, and venous outflow components of cerebral perfusion, greatly increase the computational complexity [24,25]. The number of variables and the algorithms used to calculate these variables results in variability in generating CTP threshold values for estimating core and penumbra across different vendor software. Additionally, numerical solutions to deconvolution greatly rely on accurate selection of artery input function, a parameter that is case dependent and sensitive to noise, especially given the low signal to noise ratio of perfusion images, even when preprocessing, such as motion correction, temporal and spatial smoothing, and deconvolution regularization are applied [26,27]. The deconvolution free approach developed in this study can be easily integrated into any imaging paradigm using NCCT and mCTA as a post-processing step, potentially obviating the need for CTP. Of note, the random forest classifiers used in this study to predict tissue fate at voxel- by-voxel basis generally works well with a mixture of numerical and categorical features and with a large amount of data points. Such large amount of data points can be challenging for traditional machine leaning techniques like support vector machines and logistic regression models [28]. The average processing time per patient is around 5 to 6 minutes including co-registering three phase CTA and NCCT images. Deep learning techniques, such as convolutional neural network (CNN), are also promising tools for the type of image analysis we attempted here [29]. Implementing CNNs however has some challenges. These include limitations in dealing with imbalanced samples (e.g., small objects [infarct region] vs. background) or with small training datasets that lack diversity.
The correlation between the mCTA predicted core and penumbra volume and follow-up infarct volume are moderate with CCC and ICC ranging 0.4 to 0.5. The correlation between the mCTA perfusion volume and CTP perfusion volume is stronger with CCC and ICC of >0.6. The spatial overlap between the ML predicted volume or the CTP predicted volume and follow- up infarct volume appears weak with DSC of <30%. The moderate volume correlation and weak DSC can be partially attributed to infarct growth, which can occur despite endovascular reperfusion because of delay between imaging and reperfusion or incomplete reperfusion. Moreover, accurate quantification of ischemic infarct and penumbra in patients with AIS is complex and likely influenced by many pathophysiological factors, such as cerebral autoregulation, collateral responsiveness, tissue tolerance to ischemia and hypoxia, leukoaraiosis, etc. Weak DSC can also be explained by the limitations of co-registering different imaging modalities [30]. Both DWI and follow-up infarct approaches involve registration of DWI to CT, which has inherent spatial inaccuracies due to echoplanar image distortion and differing slice thicknesses.
This study has several limitations. First, accurate quantification of ischemic infarct and penumbra in patients with AIS is complex and likely influenced by infarct location, time factors including stroke symptom onset-to-imaging and imaging- to-reperfusion time, and many pathophysiological factors, such as cerebral autoregulation, collateral responsiveness, tissue tolerance to ischemia and hypoxia, leukoaraiosis, etc [7,8,31,32]. Our current models were derived using imaging information only. Previous studies have suggested that adding clinical information, such as time [8,9] and patient characteristics [33] to the models may improve prediction accuracy. Integrating this information into mCTA based prediction models should be investigated further [7]. Second, the mCTA machine leaning models need to be improved in patients who present very early, have no or very distal occlusions, or have posterior circulation occlusions (Figure 7), etc. Increasing the amount and diversity of training data to include more such patients would help to further improve the accuracy and robustness of the model. Third, although the data used for deriving and validating the models in this study were acquired from multiple centers, testing the models externally in larger more diverse datasets is necessary to translate these results into clinical practice.
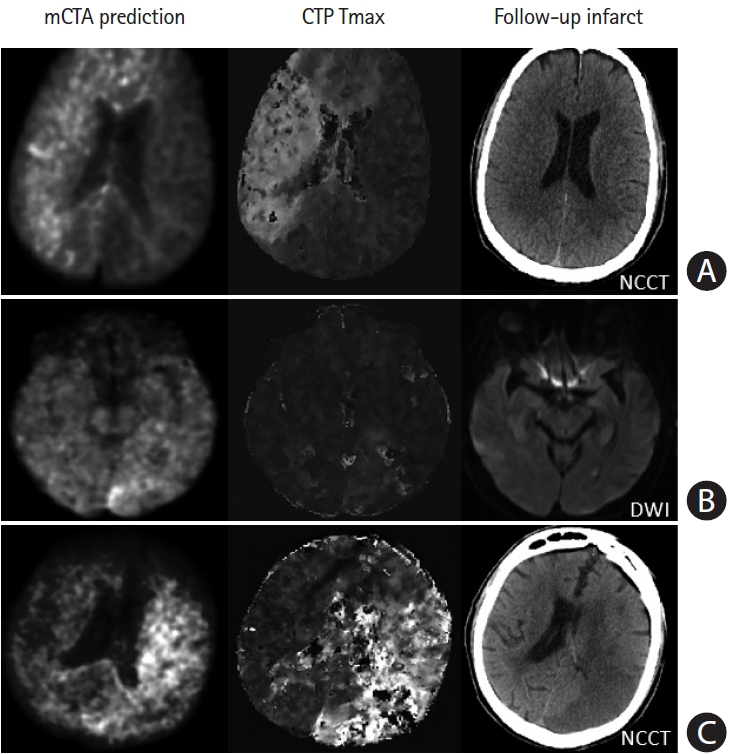
Failure cases from multiphase computed tomographic angiography (mCTA) prediction. (A) Row shows images from a patient who presented ultraearly with an onset-to computed tomography time of 21 minutes. The mCTA model significantly over-predicts follow-up infarct. (B) Row shows images from a patient without obvious occlusion; the mCTA model shows a false positive perfusion abnormality in the left posterior occipital region. (C) Row shows images of a patient with an internal carotid artery occlusion; the mCTA model under-estimates the perfusion abnormality. Column 1–3: mCTA predicted follow-up infarct, Tmax, and follow-up infarct imaging. NCCT, non-contrast-enhanced computed tomography; DWI, diffusion-weighted imaging.
Conclusions
In conclusion, as with CTP, core, penumbra, and perfusion status can be automatically predicted from mCTA imaging using ML. This work, therefore, has future potential for assisting physicians in making treatment decisions in clinical settings where CTP is not available.
Supplementary materials
Supplementary materials related to this article can be found online at https://doi.org/10.5853/jos.2020.05064.
Optimal Tmax thresholds for infarction when reperfused <90, 90 to 180 minutes, and not reperfused
Patient characteristics in patients with mTICI 2b/3 and 0/1
Predicted volumes of different models compared to follow-up infarct volume between the patients with anterior circulation (ICA, MCA, ACA) and with posterior circulation (vertebral and basilar) occlusions
Notes
Disclosure
The authors have no financial conflicts of interest.
Acknowledgements
This study is funded through an operating grant from the Canadian Institute of Health Research (CIHR) and Alberta Innovate: Health Solution (AIHS).