Delayed Lesions on Diffusion-Weighted Imaging in Initially Lesion-Negative Stroke Patients
Article information

Abstract
Background and Purpose
Lesions on diffusion-weighted imaging (DWI) occasionally appear on follow-up magnetic resonance imaging (MRI) among initially DWI-negative but clinically suspicious stroke patients. We established the prevalence of positive conversion in DWI-negative stroke and determined the clinical factors associated with it.
Methods
This retrospective, observational, single-center study included 5,271 patients hospitalized due to stroke/transient ischemic attack (TIA) in a single university hospital during 2010 to 2017. Patients without initial DWI lesions underwent follow-up DWI imaging as a routine practice. Adjusted hazard ratios (aHRs) for recurrent stroke risk according to positive conversion were determined using Cox proportional hazard regression. Adjusted odds ratios (aORs) and 95% confidence intervals (CIs) for positive conversion among initially DWI-negative patients were estimated.
Results
In total, 694 (13.2%) patients (mean±standard deviation age, 62.9±13.7 years; male, 404 [58.2%]) were initially DWI-negative. Among them, 22.5% had positive-conversion on follow-up DWI. Positive conversion was associated with a higher risk of recurrent stroke (aHR, 3.12; 95% CI, 1.56 to 6.26). Early neurologic deterioration (aOR, 15.1; 95% CI, 5.71 to 47.66), atrial fibrillation (aOR, 6.17; 95% CI, 3.23 to 12.01), smoking (aOR, 3.76; 95% CI, 2.19 to 6.63), pre-stroke dependency (aOR, 1.62; 95% CI, 1.15 to 2.27), objective hemiparesis (aOR, 4.39; 95% CI, 1.90 to 10.32), longer symptom duration (aOR, 2.17; 95% CI, 1.57 to 3.08), high cholesterol (aOR, 4.70; 95% CI, 1.78 to 12.77), National Institutes of Health Stroke Scale score (aOR, 1.44; 95% CI, 1.08 to 1.91), and high systolic blood pressure (aOR, 1.01; 95% CI, 1.00 to 1.02) were associated with a higher incidence of lesions with delayed appearance. Regarding the location of lesions on follow-up DWI, 34.6% and 21.2% were in the cortex and brainstem, respectively.
Conclusions
In DWI-negative stroke/TIA, positive conversion is associated with a higher risk of recurrent stroke. DWI-negative stroke with factors related to positive conversion may require follow-up MRI for a definitive diagnosis.
Introduction
The development of modern magnetic resonance imaging (MRI) techniques has allowed neurologists to diagnose acute ischemic stroke (AIS) based on diffusion-weighted imaging (DWI) due to its high sensitivity (88% to 100%) [1-4]. However, recent meta-analyses have shown a small but significant proportion (6.8%; 95% confidence interval [CI], 4.9% to 9.3%) of AIS cases presenting as DWI-negative [2]. DWI lesions occasionally appear on follow-up MRI in initially DWI-negative clinically suspicious stroke patients. However, clinical reports regarding the delayed appearance of DWI lesions are scarce, comprising several case reports and one small systemic study (89 patients) [5-8].
Accurately determining the existence of DWI lesions is clinically vital because their presence is associated with both a long- and short-term risk of stroke recurrence after a transient ischemic attack (TIA) or minor stroke [9-11]. DWI positivity might suggest the increased intrinsic vulnerability of the brain to infarction, and a large population-based study has shown that DWI positivity is associated with male sex, atrial fibrillation (AF), non-cryptogenic stroke etiology, and diabetes mellitus [11]. Although DWI sequences are sensitive in detecting ischemic lesions, traces of ischemic insults intermittently may not appear immediately on initial MRI scans [5-8]. Thus, to precisely determine the existence of DWI lesions, follow-up MRI studies might be beneficial in DWI-negative cases where stroke is strongly suspected.
We hypothesized that the confirmation of delayed lesions in the acute phase might be associated with subsequent clinical outcomes. We analyzed a prospective clinical stroke registry from a single university hospital, in which follow-up DWI is included in routine practice protocols, to determine clinical factors associated with final confirmation of DWI lesions in DWI-negative but clinically suspicious AIS or TIA patients. We also developed a clinical score to predict the delayed appearance of DWI lesions and compared it to the ABCD [2] score, which is currently the most prominent tool to calculate short-term stroke risk in patients with TIA.
Methods
Study population and stroke care
In total, 5,271 stroke patients were admitted to the cerebrovascular service of Seoul National University Bundang Hospital via the emergency room (ER) during 2010 to 2017. Stroke or TIA was clinically diagnosed by a stroke physician or duty residents, and confirmed by relevant neuroimaging, preferably using MRI, including DWI. DWI-negative cases were conditionally admitted upon high clinical suspicion. Responsible stroke physicians carefully selected patients whose symptoms could not be explained by causes besides stroke or TIA, with scrutiny of the history and physical examination and after excluding stroke-mimicking syndromes such as seizure, encephalopathy, conversion disorder, malingering, and peripheral neuropathy. We selected study subjects according to the following criteria: (1) no diffusion-restricted lesion on the initial DWI obtained in the ER (n=827) and (2) follow-up DWI within 7 days of ER arrival (n=751). We further excluded 57 cases based on the following criteria: (1) hemorrhagic stroke on baseline or followup images (n=4) and (2) diagnostic or therapeutic cerebral angiography between baseline and follow-up images (n=53), due to the fact that cerebral angiographic studies could induce DWI lesions in up to 30% of cases [12]. Only first admissions were included in the dataset. The final study population included 694 cases.
This study was an analysis of retrospectively collected clinical data. Acute stroke management was individually decided and performed according to the institutional protocols, the most up-to-date local and international clinical guidelines, and at the discretion of the responsible physician. In our stroke center, if there is no early neurologic deterioration, follow-up MRI scans at 3 to 5 days after onset, including DWI, are generally recommended to assess the final location and volume of infarctions [7,13]. When early neurologic deterioration is detected, follow-up MRI scans are performed immediately.
Use and analysis of patient data were approved by the Institutional Review Board of the Seoul National University Bundang Hospital (IRB number: B-1911-574-101). The clinical data and patient outcomes were primarily collected for our hospital’s quality improvement program.
Data collection
We retrieved demographic and clinical information from the Clinical Research Collaboration for Stroke in Korea registry, which is a multicenter, prospective, and clinical stroke registry in South Korea. Demographic information included age, sex, systolic and diastolic blood pressure (BP) at presentation, height, weight, body mass index, baseline and discharge National Institutes of Health Stroke Scale (NIHSS) scores, functional dependency before the index stroke, functional dependency at the time of discharge, presence of early neurologic deterioration, mode of onset, hypertension, diabetes mellitus, dyslipidemia, habitual smoking, AF, and time indices [14,15]. Presenting signs and symptoms were extracted using medical record review by a trained neurologist (K.K.) and included dysarthria, weakness, dizziness, veering tendency, ataxia, hypoesthesia, paresthesia, aphasia, diplopia, and the duration of presentation of signs or symptoms. Relevant signs and symptoms were considered only if they occurred within 7 days prior to the ER visit. The longest duration of recurrent signs and symptoms was recorded; the duration of signs and symptoms were categorized as unknown, <10, 10 to 59, or ≥60 minutes [16]. Laboratory information included hemoglobin A1c, creatinine, and total cholesterol. The composite vascular outcome included recurrent stroke, myocardial infarction, and vascular death. Finally, recurrent vascular events after stroke were collected through routine clinical visits after discharge or structured telephone interviews performed by a trained research registrar (M.H.Y.).
MRI protocols and assessments
MRI was performed using a 1.5- or 3-T MRI scanner (Intera for 1.5-T, Intera Achieva or Ingenia for 3-T, Philips Health Care, Best, the Netherlands). Conventional 5-mm images and 2-mm thinsection images of the brainstem are included in the routine stroke magnetic resonance protocol in our center, employing an echo planar imaging (EPI) sequence with b‐values of 0 and 1,000 sec/mm2 for diffusion weighting. Conventional 5-mm DWI parameters were repetition time/echo time (TR/TE), 70,000/65 ms; slice thickness/interspacing, 5.0/1.0 mm; field of view (FOV), 230×230 mm2; phase/frequency resolution, 160×160; voxel size, 1.4×1.4×5.0 mm3; bandwidth, 1,283 Hz/Px, and EPI factor, 77. Whole brain coverage was achieved in 25 slices with an acquisition time of 1 minute 31 seconds. Thinsection 2-mm DWI parameters were TR/TE, 9,520/63 ms; slice thickness/interspacing, 2.0/0.2 mm; FOV, 230×230 mm2; base resolution, 256×256; voxel size, 0.9×0.9×2.0 mm3; bandwidth, 802 Hz/Px; and EPI factor, 115. Posterior fossa coverage was achieved in 35 slices with an acquisition time of 3 minutes 29 seconds.
The presence of diffusion-restricted lesions on initial and follow-up MRI was visually assessed by board-certified neuroradiologists (chaired by J.H.K.) as routine clinical practice. Unclear neuroradiologists’ readings, including diffusion-restricted lesions due to other evident causes, such as hemorrhagic stroke, were retrospectively clarified and determined by an experienced vascular neurologist (B.J.K.) and trained neurologist (K.K.).
Statistical analysis
One aim of this study was to derive and validate a model to predict DWI-positive conversion in follow-up MRI scans. Given that we used observational data without external validation sets, the data were divided into two groups for temporal external validation. We used cases from 2010 to 2015 (n=488) as the model development set, and cases from 2016 to 2017 (n=206) as the external validation set. To check the validity of the division, baseline clinical characteristics for the development and validation data sets were summarized and compared. Categorical variables are presented as number of subjects (%) and were compared using the chi-square test. Continuous variables are presented as mean±standard deviation and were compared using the two-sample t-test with and without the equal variance assumption. The statistical significance of each variable is reported in Table 1. Survival analysis of outcome events (recurrent stroke, all-cause mortality, and composite vascular outcome) over the entire follow-up period was performed using the Kaplan–Meier technique with the log-rank test (Figure 1). We used Cox proportional hazards survival analysis to determine the risk of each outcome after adjustments for age, AF, smoking, pre-stroke dependency, objective hemiparesis, high cholesterol levels, NIHSS score, and high systolic BP (Table 2 and Figure 1).

Baseline characteristics and outcomes of study subjects (n=694)
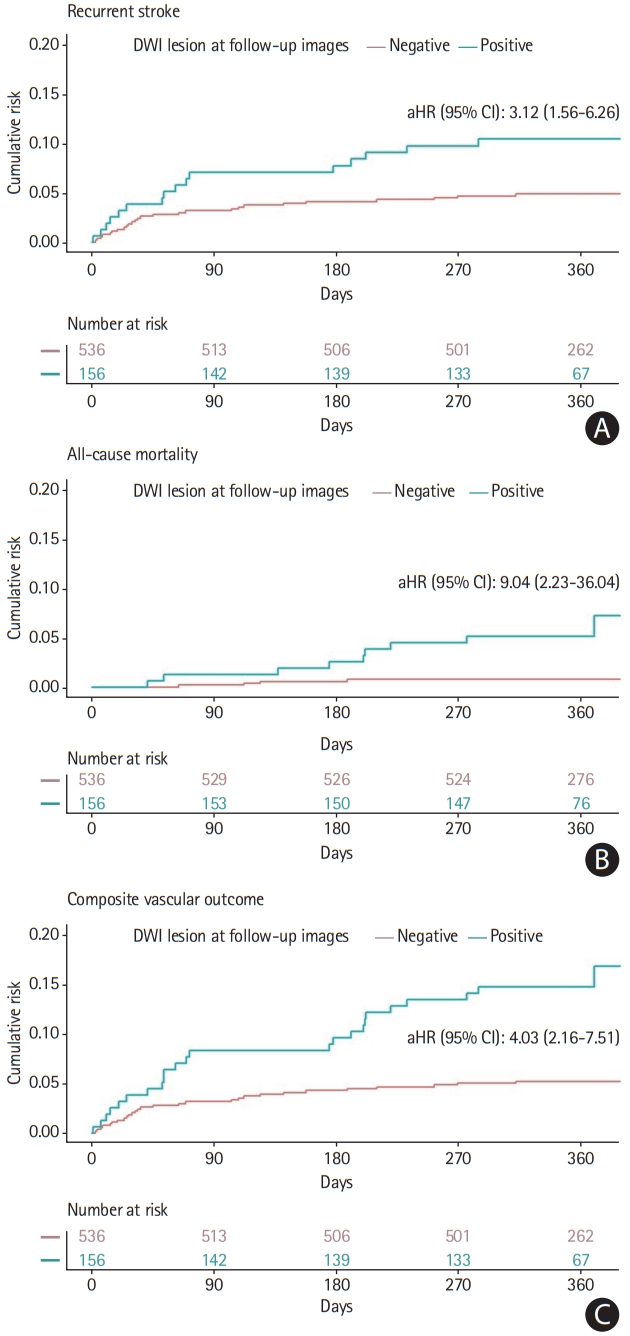
Hazard curves for 1-year stroke recurrence, all-cause mortality, and composite vascular outcome according to the presence of delayed diffusion-weighted imaging (DWI) lesions. Survival curves for (A) recurrent stroke, (B) all-cause mortality, and (C) composite vascular outcome by the presence of delayed DWI lesion. All P<0.01 using log-rank test. Data were adjusted for age, atrial fibrillation, smoking, pre-stroke dependency, objective hemiparesis, high cholesterol, National Institutes of Health Stroke Scale score, and high systolic blood pressure. Calculated using the log-rank test for P-value and Cox regression test for the adjusted hazard ratio (aHR). CI, confidence interval.
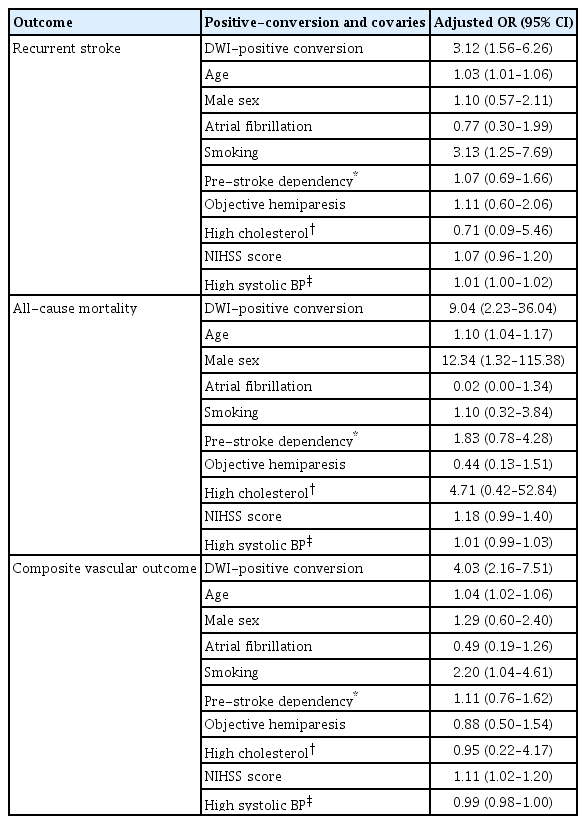
Full models for the effects of positive conversion and covariates in recurrent stroke, mortality, and composite vascular outcome
Using a binary outcome of DWI conversion as the dependent variable, logistic regression was performed for each variable including age and sex. The P-values of the logistic regression models were used as the selection criteria with a threshold <0.05. The variables were then adjusted in a multivariable model. A stepwise variable selection method was used in the multivariable analysis to minimize the collinearity effect. First, vascular risk factors were analyzed using multivariable analysis after adjustments for age and sex. Second, signs and symptoms were analyzed using multivariable analysis after adjustments for age, sex, and the significant variables during the first step.
To develop a new risk scoring system called the DWI-CONVERSION score, a scoring method similar to that of Sullivan et al. [17] was employed based on the developed risk model. Forward selection of the variables was conducted in the order of the significance of the OR of each single variable, using the c-statistic as a measure of model performance. The value added to the c-statistic was used to quantify the additional contribution of these factors in risk reclassification. The bootstrapping technique was used to adjust overfitting to our training set, which could lead to optimistic model performance. An optimism-corrected c-statistic using 1,000 bootstrap samples was created with replacement and then presented.
External validation of the risk score was conducted to assess the stability of the model. Furthermore, the c-statistic of the ABCD [2] score system in the external validation group was measured and compared with that of the DWI-CONVERSION score [18]. The receiver operating characteristic (ROC) curves for each model were compared using a non-parametric method proposed by Delong et al. [19]. Statistical analyses were performed using R version 3.3.2 (R Foundation for Statistical Computing, Vienna, Austria).
Results
Overall, DWI-negative stroke in the ER was found in 827 (15.7%) of 5,271 stroke or TIA patients. Of the 694 patients in the analysis dataset who had DWI-negative stroke without hemorrhage or cerebral angiographic studies, the mean age at onset was 62.9±13.7 years, and 404 (58.2%) of the patients were male. A witnessed onset of symptoms was noted in 563 cases (81.1%). The most common signs and symptoms were subjective hemiparesis (n=368, 53.0%) and dysarthria (n=308, 44.4%). Early neurologic deterioration was noted in 23 patients (3.3%). The median time delay from onset to the initial MRI was 4.4 hours (interquartile range [IQR], 2.0 to 10.5); the median time from onset to follow-up MRI was 61.0 hours (IQR, 45.9 to 83.5). The delayed appearance of DWI lesions in initially DWI-negative patients, referred to as DWI-positive conversion, was documented in 156 (22.5%) cases (Table 1).
The positive conversion group had 17 (10.9%) cases of recurrent stroke compared to 27 (5.0%) cases in the DWI-negative group. The median follow-up time was 360 days (IQR, 347 to 372). Similarly, the positive conversion group had nine (5.8%) cases of all-cause mortality, compared to five (0.9%) cases in the DWI-negative group. Three (0.6%) cases in the DWI-negative group and three (1.9%) in the positive conversion group had cardiovascular mortality. Finally, the positive conversion group had 25 (16.0%) cases of vascular composite outcome compared to 30 (5.6%) cases in the DWI-negative group. Positive conversion was related to poorer prognosis (log-rank test: recurrent stroke, P<0.01; all-cause mortality, P<0.001; vascular composite outcome, P<0.001). After adjustments for age, AF, smoking, pre-stroke dependency, objective hemiparesis, high cholesterol, NIHSS score, and high systolic BP, this association remained significant (Cox regression: recurrent stroke [adjusted hazard ratio, aHR, 3.12; 95% CI, 1.56 to 6.26], all-cause mortality [aHR, 9.04; 95% CI, 2.23 to 36.04], vascular composite outcome [aHR, 4.03; 95% CI, 2.16 to 7.51]) (Table 2).
To develop the DWI-CONVERSION score, we divided the dataset into the model development set (n=488) and external model validation set (n=206). These two datasets were comparable, except for two variables, dizziness symptoms, and MRI follow-up time (Table 1).
In the development set, DWI conversion occurred in 111 (22.7%) cases. The stepwise multivariable logistic regression model showed that DWI conversion was significantly associated with AF, habitual smoking, functional dependency before the index stroke, objective hemiparesis, longer duration of symptoms, early neurologic deterioration, total cholesterol >240 mg/dL, baseline NIHSS score, and baseline systolic BP (Table 3). Early neurologic deterioration showed the highest (adjusted odds ratio [aOR], 15.10; 95% CI, 5.71 to 47.66). Among indicators that could be detected in the ER, AF (aOR, 6.17; 95% CI, 3.23 to 12.01), objective hemiparesis (aOR, 4.39; 95% CI, 1.90 to 10.32), and total cholesterol level (aOR, 4.70; 95% CI, 1.78 to 12.77) had the highest aOR. Symptoms related to the posterior vascular territory or brainstem lesions such as dizziness, veering tendency, or ataxia were not significant in either the univariable or multivariable analysis.

Significant clinical characteristics by groups according to the presence of delayed DWI lesions
We constructed the DWI-CONVERSION score using significant clinical and laboratory factors identified in the model development dataset after removing collinearities between similar variables, such as the NIHSS score and objective hemiparesis (Table 4). In the model development cohort, the DWI-CONVERSION score was distributed as follows: the lowest quartile had scores ≤3, second quartile had scores 4–6, third quartile had scores of 7–8, and top quartile had scores ≥9. The association between the total score and the observed incidence of DWI-positive conversion on follow-up MRI is shown in Table 5. Model calibration in both the derivation and validation groups was good across all risk strata (Supplementary Figure 1).

DWI-CONVERSION score (0–39 points) to predict delayed DWI lesions
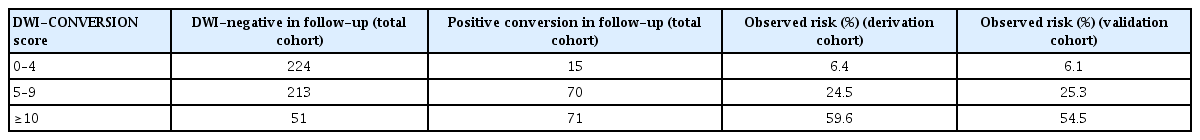
Observed incidence of DWI-positive conversion on follow-up MRI
The optimism-corrected c-statistic of the DWI-CONVERSION score based on 1,000 bootstrap replicates was 0.813 (95% CI, 0.769 to 0.856) in the derivation cohort and 0.808 (95% CI, 0.743 to 0.872) in the validation cohort, which was significantly higher than that for the ABCD [2] score in the validation cohort (c-statistic, 0.678; 95% CI, 0.590 to 0.765; P<0.01) (Figure 2).

Receiver operating characteristic (ROC) curve of diffusionweighted imaging (DWI)-CONVERSION score in the derivation and validation cohorts and the ABCD2 score in the validation cohort. The optimismcorrected c-statistic of the DWI-CONVERSION score based on 1,000 bootstrap replicates was 0.813 (95% confidence interval [CI], 0.769 to 0.856) in the derivation cohort and 0.808 (95% CI, 0.743 to 0.872) in the validation cohort, which is significantly higher than that for the ABCD2 score in the validation cohort (c-statistic=0.678; 95% CI, 0.590 to 0.765; P<0.01). AUC, area under the curve.
Regarding the locations of lesions on follow-up DWI, 34.6% (n=54) were in the cortex, 32.7% (n=51) in the subcortex, 21.2% (n=33) in the brainstem, 13.5% (n=21) in the basal ganglia, 10.9% (n=17) in the cerebellum, 10.3% (n=16) in the thalamus, and 4.5% (n=7) in the internal capsule. Finally, 39.1% (n=61) of cases had multiple lesions, of which 18.0% (n=11) were spread among multiple vascular territory lesions.
Discussion
Among 5,271 consecutive stroke or TIA patients who were admitted, 827 (15.7%) had DWI-negative stroke at presentation. Of the 694 DWI-negatirve patients without invasive diagnostic procedures or cerebral hemorrhage, positive conversion of DWI lesions was documented in 156 (22.5%) cases. The positive conversion group had a significantly higher risk of recurrent stroke, all-cause mortality, and composite vascular outcome relative to the non-conversion group. Clinical factors, signs, and symptoms that were associated with DWI conversion included AF, smoking, pre-stroke dependency, early neurologic deterioration, objective hemiparesis, longer duration of symptoms, high cholesterol, NIHSS score, and high systolic BP at presentation. To our knowledge, this is the first study to determine the prognosis and factors associated with delayed-lesion confirmation among initially DWI-negative patients.
Several studies on initial DWI-negative stroke or TIA patients exist, although their study populations were relatively small compared to that in our study [5,6,20-23]. The current literature reports varying proportions of initial DWI negativity in AIS patients, ranging from 0% to 33%. Moreover, factors that have been shown to be associated with initial DWI-negative cases include the time between MRI and onset, lower NIHSS, small lesions located in the posterior vascular territory, and clinical syndromes such as ataxic hemiparesis, internuclear ophthalmoplegia, and lateral medullary syndromes [5,6,20-23]. These findings were partially replicated in our study, as DWI-negative cases had lower NIHSS scores and a shorter time from symptom onset to initial MRI. Despite this partial congruence, in our study, the most common presenting signs and symptoms were hemiparesis and dysarthria, and it may be inferred that general AIS and TIA with mild initial severity could appear DWI-negative at presentation. Our analysis was based on all consecutive AIS and TIA admissions over an 8-year period, and we utilized 2-mm thin-section DWI protocols to not miss possible brainstem lesions. A single-center study reported that DWI-negative stroke patients converted into lesion-positive strokes in 9% of cases, which is a lower rate than that in our study (22.5%) [6]. However, fluid-attenuated inversion-recovery was their main imaging modality at 30 days of follow-up.
Two possible explanations exist for the positive conversion of DWI lesions. First, a primary ischemic insult might not be severe enough to induce biological changes, resulting in the initial absence of lesions on DWI. A secondary insult, such as stroke recurrence or prolonged ischemic burden, may then follow, eventually making the lesion detectable. The resilience or recovery ability of brain tissues may also contribute to this initial absence by raising the ischemic threshold. Second, although biological changes exist, technological or biochemical causes may mean the damage is not detected on DWI. The resolution of MRI scanners and imaging parameters, combined with magnetic susceptibility artifacts, may hinder earlier detection of small DWI lesions, which become more distinguishable as cytotoxic edema and swelling ensue [5,24].
For the first type of cases involving initially insufficient biological changes, stroke recurrence might be a main reason for positive conversion, and such an event would be readily detectable by monitoring patients for early neurological deterioration during admission. Prolonged ischemic burden is another possible reason for the first type of cases. This could be roughly predicted by analyzing regional vascular or perfusion statuses, but such data were not included in this study. Smoking, higher cholesterol levels, and pre-stroke functional capacity could affect the resilience or recovery capability of brain cells. Smoking could affect the resilience of cells as a consequence of smoke-induced inflammation and DNA damage [25]. Higher cholesterol levels could reduce the ischemic recovery of brain cells due to arterial stenosis or direct free cholesterol-induced cytotoxicity [26,27]. Functional independence before the index stroke was reported to be associated with better outcomes [28,29]. For the latter type of cases where the existing biological changes are not detectable, longer duration of symptoms, higher initial NIHSS, objective hemiparesis, and AF might be associated with more cellular damage and, therefore, higher mean diffusivity on DWI [30].
Various recent studies have shown a poorer prognosis of tissue-positive events compared to that of tissue-negative events, thus contributing to the transition from time-based to tissue-based definitions of AIS and TIA [1,9,11,31,32]. Similarly, we have demonstrated that the positive conversion of DWI lesions is also associated with a higher risk of vascular outcomes. To help identify patients with a higher probability of DWI conversion among initially DWI-negative cases, we constructed the DWI-CONVERSION score from clinical features and patients’ signs and symptoms, all of which are readily available in the ER. Our study results may contribute to the development of clinical guidelines regarding admission, careful monitoring in a stroke unit, and follow-up DWI scans during in-hospital care. If the lesion is confirmed on follow-up DWI, a stroke physician should consider a more aggressive stroke etiology workup and medical therapy.
In the DWI-CONVERSION score, except veering tendency and time from symptom onset to the initial MRI, all factors were associated with DWI-positive conversion in our multivariable analysis. Previous studies have shown that several stroke syndromes, including ataxic hemiparesis and lateral medullary syndrome, and a shorter time interval between initial imaging and symptom onset were associated with positive conversion on DWI. According to previous studies, this association may be attributed to focal brainstem infarctions and covert ischemic lesions during the hyperacute period, possibly due to insufficient diffusivity restriction [5,23]. If the lesion is small, brainstem lesions are more difficult to identify than cerebral lesions on DWI because of brainstem image distortion on DWI scans [5].
Brainstem and cerebellar lesions had a high positive conversion rate on follow-up DWI (21.2%, and 10.9%, respectively, of all delayed lesions), particularly considering that the proportion of brainstem and cerebellar stroke to total stroke is approximately 10% and <10%, respectively [33-37]. Several studies have stressed the posterior circulation territory in DWI negative stroke cases due to the small lesion size, insufficient signal-to-noise ratio, and magnetic susceptibility artifact [5,23]. Our study also showed that the brainstem and cerebellar area in the posterior circulatory territory might be a susceptible area in DWI-negative stroke cases.
The aHRs of all three outcomes for those with AF were not significant, as shown in Table 2. Most included patients were diagnosed with minor stroke or TIA, and most observed lesion sizes were small. Cardiac embolisms may be of any size, but when arising from the cardiac chambers, they are often large and likely to cause a severe stroke [38]. Considering these factors, a substantial portion of the positive conversion in our research might not be etiologically related to AF.
This study has several limitations. First, this was a retrospective analysis of prospectively collected stroke and TIA admission cases. Therefore, future prospective and interventional studies are needed to validate our findings. Second, the DWI-CONVERSION score needs to be validated in different clinical settings. Third, we used neuroradiologists’ image reports to identify DWI lesions for clinical applicability. Fourth, further image analysis, including relevant vascular stenosis, perfusion status, and lesion size in cases of positive conversion, was not conducted. Fifth, although we routinely included 2-mm thinsection DWI protocols, there still may have been missed lesions. Sixth, we did not study other brain imaging findings, including old infarct lesions, white matter change, arterial occlusion, and perfusion defects, in our patient group. Seventh, we did not investigate the outcomes and associated factors of patients with initial DWI lesions. Eighth, the DWI-CONVERSION score system is skewed to the right. The median of the overall retrospective NIHSS score from the Cincinnati/Northern Kentucky Stroke Study was 3 (IQR, 1 to 7). Moreover, our patient group mostly had minor stroke or TIA, which may in part explain the skewed distribution of the DWI-CONVERSION score [39].
Conclusions
Among stroke and TIA admissions over the course of 8 years, 15.7% of cases had initial DWI-negative scans at the beginning of follow-up. Follow-up DWI scans during in-hospital care revealed that the delayed appearance of DWI lesions occurred in 22.5% of the selected patients. Although DWI-negative patients had mild neurological impairment at presentation, mounting evidence indicates that such patients may carry substantial cardiovascular risk if ischemic lesions are documented afterward. The DWI-CONVERSION score, which was developed to identify patients at high risk of positive conversion among initially DWI-negative stroke and TIA patients, showed improved discriminative power for DWI conversion on follow-up images. The brainstem and cerebellar regions showed a high conversion rate, and 39.1% of patients with positive conversion had multiple lesions. Our results suggest that neurologists should be aware of the possibility of the delayed appearance of DWI lesions in initially DWI-negative patients with high DWI-CONVERSION scores. Our results and the DWI-CONVERSION score must be validated in different clinical and epidemiological settings.
Supplementary materials
Supplementary materials related to this article can be found online at https://doi.org/10.5853/jos.2020.02110.
Observed versus predicted diffusion-weighted imaging (DWI) conversion risk according to deciles of predicted risk in the derivation cohort. Predicted probabilities are based on the association of the DWI-CONVERSION score with predicted probability and are shown for the derivation cohort (red line) and validation cohort (blue line). The dotted line connects the estimates for each stratum.
Notes
Disclosure
The authors have no financial conflicts of interest.
Acknowledgements
Jaewon Huh was supported by Human Frontiers in Sciences Program LT000911/2018-C.