Imaging of Intracranial Hemorrhage
Article information
Abstract
Intracranial hemorrhage is common and is caused by diverse pathology, including trauma, hypertension, cerebral amyloid angiopathy, hemorrhagic conversion of ischemic infarction, cerebral aneurysms, cerebral arteriovenous malformations, dural arteriovenous fistula, vasculitis, and venous sinus thrombosis, among other causes. Neuroimaging is essential for the treating physician to identify the cause of hemorrhage and to understand the location and severity of hemorrhage, the risk of impending cerebral injury, and to guide often emergent patient treatment. We review CT and MRI evaluation of intracranial hemorrhage with the goal of providing a broad overview of the diverse causes and varied appearances of intracranial hemorrhage.
Introduction
Intracranial hemorrhage (ICH) is a significant medical event that accounts for up to 15% of strokes [1]. The incidence of ICH is approximately 25 per 100,000 person-years, and it has a mortality of 40% within one month of presentation [1]. ICH may occur in multiple intracranial compartments and may be caused by diverse pathology. Neuroimaging is essential for the treating physician to understand the location and volume of hemorrhage, the risk of impending cerebral injury, and to guide often emergent patient treatment.
Here we review the imaging of ICH with the goal of providing a broad overview of the diverse causes and varied appearances of ICH. The most common vascular causes of ICH are discussed, but this article is not intended to be inclusive of all causes of ICH. ICH secondary to trauma and vascular causes is emphasized, but ICH due to primary or metastatic neoplasms is not discussed. The use of computed tomography (CT) is emphasized as it is the most commonly performed technique in the emergency evaluation of patients with suspected or known ICH, but Magnetic Resonance Imaging (MRI) is also discussed.
Traumatic intracranial hemorrhage
Trauma is the most common cause of ICH, and CT of the head is the initial workup performed to evaluate the extent of acute traumatic brain injury [2]. MRI is increasingly being performed in the emergency department for the evaluation of traumatic brain injury, and MRI has been shown to be more sensitive than CT in the detection of small foci of intracranial hemorrhage or axonal injury [3-5].
Trauma may result in ICH through direct or indirect injury of arteries and veins located deep to the skull, and these injuries may result in ICH overlying the brain parenchyma or within the brain parenchyma. The most commonly encountered types of traumatic ICH include subarachnoid hemorrhage (SAH), epidural hematoma, subdural hematoma, hemorrhagic parenchymal contusions, and cerebral microhemorrhage due to shear injury [2]. These various forms of traumatic ICH are discussed further below.
Traumatic subarachnoid hemorrhage
Traumatic SAH is the most commonly encountered form of traumatic ICH [6,7]. SAH occurs when there is arterial or venous injury to the vessels coursing through the subarachnoid space overlying the brain parenchyma, and is identified on CT as an abnormal hyperdensity in the subarachnoid space. Traumatic SAH typically distributes in the cerebral sulci overlying the brain near the vertex of the head and tends to spare the basal cisterns (Figure 1), although severe trauma may result in diffuse SAH. In the setting of a large volume of traumatic SAH, cerebral arterial vasospasm may rarely develop, which places patients at risk of cerebral infarction several days following the traumatic event [8,9].

Traumatic SAH following a motor vehicle crash. (A) NCCT demonstrates hyperdense SAH (arrow) within the cerebral sulci near the convexity. A subdural hematoma overlying the left cerebral hemisphere (arrowhead) and a subgaleal hematoma overlying the right parietal bone (dashed arrow) are also present. (B) FLAIR MRI sequence demonstrates SAH as hyperintense signal within the cerebral sulci (arrow) and the left subdural hematoma as hyperintense signal overlying the left parietal lobe (arrowhead). The subgaleal hematoma overlying the right parietal bone is again seen (dashed arrow). (C) GRE MRI demonstrates SAH as hypointense signal within the cerebral sulci (arrow) and the left subdural hematoma as hypointense signal overlying the left parietal lobe (arrowhead). The subgaleal hematoma overlying the right parietal bone is also present (dashed arrow). SAH, subarachnoid hemorrhage; NCCT, non-contrast CT; FLAIR, Fluid Attenuated Inversion Recovery; MRI, magnetic resonance imaging; GRE, gradient-echo; CT, computed tomography.
MRI is less commonly performed acutely for the evaluation of traumatic SAH, which is typically evaluated by CT. However, MRI has an excellent sensitivity for the detection of acute ICH, and traumatic SAH may be identified as hyperintense signal abnormality overlying the cerebral sulci on Fluid Inversion Attenuation Recovery (FLAIR) sequences or hypointense susceptibility blooming on Gradient-Echo (GRE) or susceptibility-weighted imaging (SWI) sequences (Figure 1) [10-12]. The combination of FLAIR and SWI MRI sequences has been shown to be superior to CT in the detection of acute SAH [13].
Epidural hematoma
Acute epidural hematomas are identified on head CT as a hyperdense collection in the epidural space, which is located between the inner table of the skull and the dura mater. Because epidural hemorrhage is interposed between the skull and dura mater, its extent is limited by adjacent sutures between the bones of the skull. As the volume of hemorrhage increases, the epidural blood extends along the inner table of the skull up to the nearest suture boundary. As the epidural hemorrhage maximizes its lateral extension to the suture margins, the hemorrhage then increases in the superficial to deep dimension, which results in the so called “crescentic” or “biconvex” appearance of epidural hematomas (Figure 2).
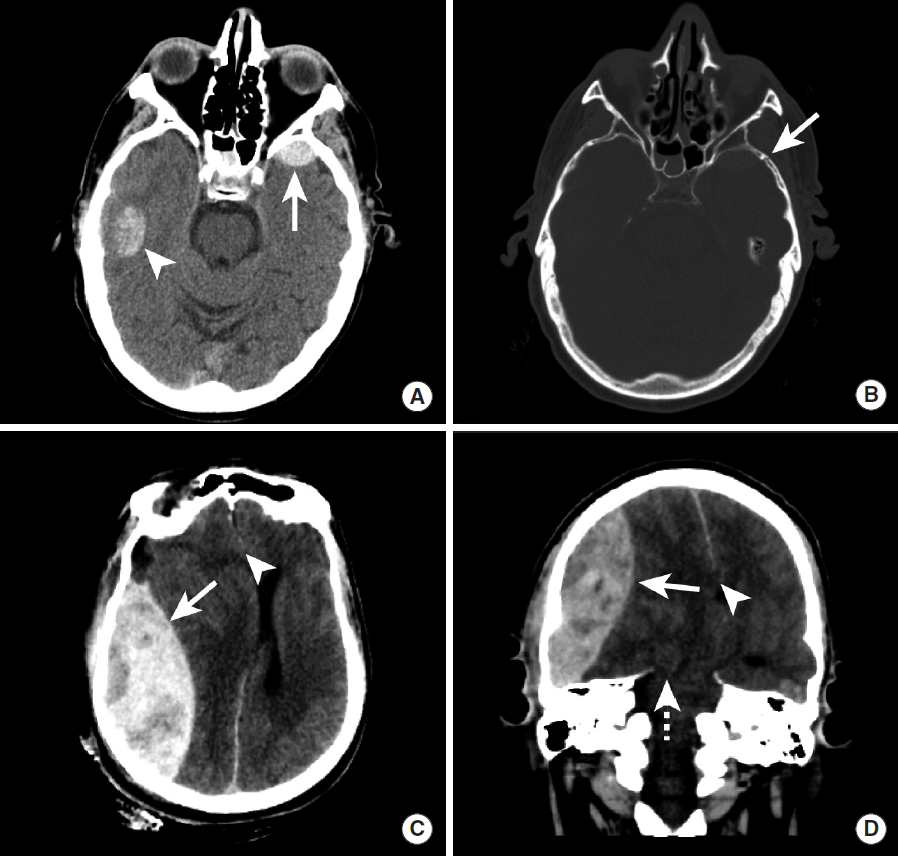
Traumatic intracranial hemorrhage in two patients. NCCT was performed in a patient with decreased mental status following a bicycle crash (A, B). A hemorrhagic parenchymal contusion is present in the right temporal lobe (A, arrowhead), and a crescentic epidural hematoma is present anterior to the left anterior temporal lobe (A, arrow). A non-displaced temporal bone fracture is present adjacent to the epidural hematoma (B, arrow). A second patient with obtundation after a motor vehicle crash underwent a NCCT (C, D). A large biconvex epidural hematoma (C, D, arrows) exerts significant mass effect on the right cerebral hemisphere and results in leftward midline shift and subfalcine herniation (C, D, arrowhead) and right uncal herniation (D, dashed arrow). NCCT, non-contrast CT.
Epidural hematomas may be caused by laceration of arteries or veins running along the inner table of the skull, and injury to these vessels is often accompanied by an associated skull fracture [14]. Bleeding secondary to arterial injury is thought to result in larger and more rapidly growing epidural hematomas than epidural hematomas that occur secondary to venous injury.
Epidural hematomas may be characterized clinically by a lucid interval, in which the patient is largely asymptomatic or not critically ill [15]. This lucid interval comprises the time between the traumatic injury and the accumulation of hemorrhage in the epidural space before it exerts mass effect on the adjacent brain [15]. However, once the epidural hematoma reaches a large enough size, it may exert significant mass effect on the adjacent brain that results in midline, subfalcine, or trans-tentorial herniation that may rapidly progress to patient obtundation or death (Figure 2). Therefore, patients with an epidural hematoma identified by CT scan should be taken to the operating room for emergent evacuation of the epidural hematoma in the setting of neurologic deterioration or very closely monitored if they are not in clinical extremis.
Subdural hematoma
Acute subdural hematomas are identified on head CT as hyperdense hemorrhage into the subdural space, which is interposed between the arachnoid and pia mater [16]. Small subdural hematomas may be obscured by volume averaging with adjacent bony structures, and the radiologist should window the CT scan such that the density of blood is sufficiently different from that of the adjacent bone (suggested “subdural” window width 130 and window level of 30) to increase the detection of these small hematomas. Additionally, the use of coronal reformations has been shown to increase the detection rate of small extra-axial collections, and these reformations should be included in all trauma protocols [17,18].
Because the subdural hemorrhage occurs deep to the dura mater, its extent is not limited in the lateral dimension by the bony sutures. Therefore, subdural hematomas may cross suture lines, which may distinguish them from epidural hematomas (Figure 3). Subdural hematomas are bounded in the medial-to-lateral dimension by the falx cerebri and in the superior to inferior dimension by the tentorium cerebri, and subdural hematomas frequently extend along the ipsilateral side of these structures in an unopposed manner (Figure 3).
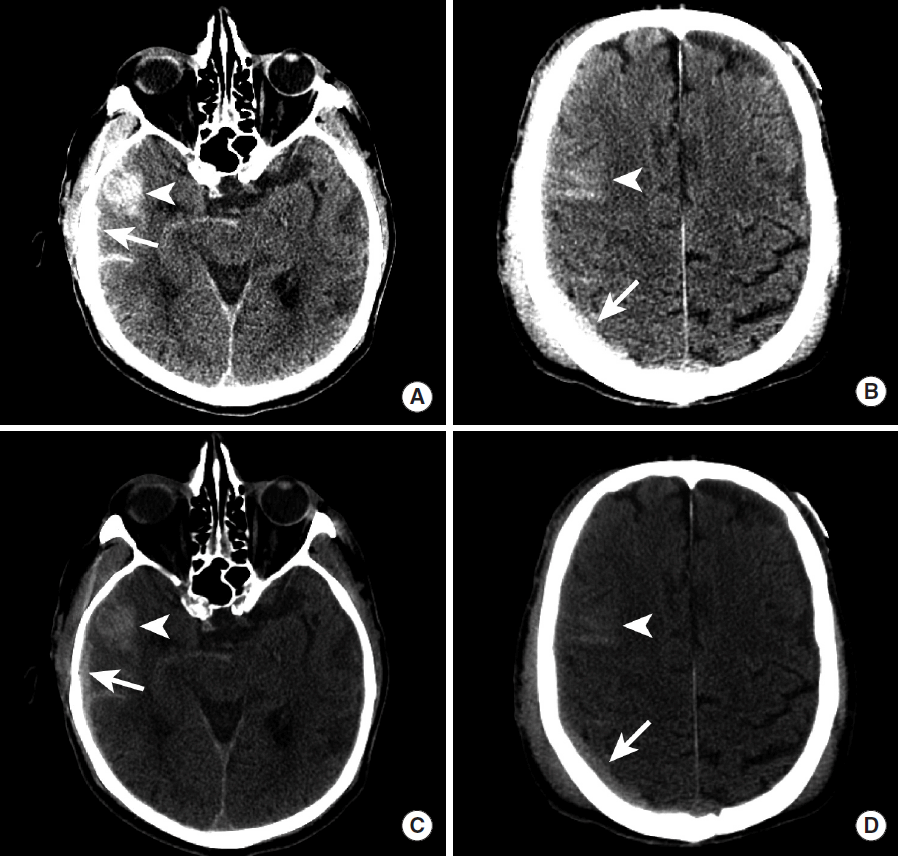
CT window and level adjustment to visualize subdural hematomas. A patient with traumatic ICH underwent a NCCT. Standard brain window of 75 and level of 20 (A, B) and an optimal subdural window of 150 and level of 30 (C, D) are shown. A hemorrhagic contusion in the right anterior temporal lobe (A, C, arrowhead) and sulcal SAH overlying the right frontal lobe (B, D, arrowhead) are well seen using both window/level combinations. A right hemispheric subdural hematoma (A-D, arrows) is less well seen on standard brain windows (A, B) when compared to the subdural window/level (C, D). CT, computed tomography; ICH, intracranial hemorrhage; NCCT, non-contrast CT; SAH, subarachnoid hemorrhage.
Subdural hematomas are most commonly caused by injury to the venous structures that course deep to the dura mater, and subdural hematomas are less likely to be accompanied by skull fractures [6,16]. Compared to epidural hematomas, subdural hematomas are less likely to be acutely symptomatic due to the slower rate of growth caused by venous injury and the larger lateral extent permitted by the subdural space. However, large subdural hematomas may result in significant mass effect on the adjacent brain and midline or transtentorial herniation that may require emergency evacuation (Figure 4) [19].

Brain herniation due to a large subdural hematoma. NCCT images in a patient with a large left hemispheric subdural hematoma. The subdural hematoma (A-C, arrows) results in effacement of the basal cisterns (A, arrowhead), subfalcine herniation (B, C, arrowheads), and left uncal herniation (C, dashed arrow). NCCT, non-contrast CT.
Hemorrhagic parenchymal contusion
Hemorrhagic parenchymal contusions most commonly occur with significant head motion and head impact [20]. These contusions are characterized on CT as hyperdense hemorrhage within the brain parenchyma itself, and they are caused by microvascular arterial or venous injury. MRI is more sensitive than CT for the detection of small focal hemorrhagic contusions, especially when volumetric GRE sequences are obtained (Figure 5) [21,22]. Hemorrhagic parenchymal contusions have a predilection for the anterior and posterior temporal lobes, and the inferior frontal lobes, all of which are located adjacent to the bony structures of the skull (Figure 5) [20]. In the setting of significant force, the brain impacts the adjacent skull with deformation of the underlying brain that results in hemorrhagic parenchymal contusions. Understanding this mechanism of injury allows one to understand why these parenchymal contusions are frequently located in the brain at the site of or opposite to the site of head impact, the so called “coup” and “contre-coup” pattern of head injury.

Hemorrhagic parenchymal contusions detected by CT and MRI. A patient with traumatic ICH was underwent evaluation by NCCT (A) and MRI that included GRE (B) and SWI (C) sequences. The conspicuity of hemorrhagic contusions (arrows) is increased on both GRE and SWI MRI sequences compared to CT. Cerebral microhemorrhages are present in the cerebral white matter on both GRE and SWI sequences (arrowheads). CT, computed tomography; MRI, magnetic resonance imaging; ICH, intracranial hemorrhage; NCCT, non-contrast CT; GRE, gradient-echo; SWI, susceptibility-weighted imaging.
Hemorrhagic parenchymal contusions should prompt follow-up head imaging, as these contusions may grow in size in a relatively short period of time (Figure 6). Thus, small foci of parenchymal contusions may become sites of large intraparenchymal hemorrhage with significant mass effect on the surrounding brain that may require neurosurgical decompression or evacuation. An awareness of this potential growth is essential to avoid insufficient monitoring or premature discharge of a patient with small hemorrhagic parenchymal contusions from the emergency department.
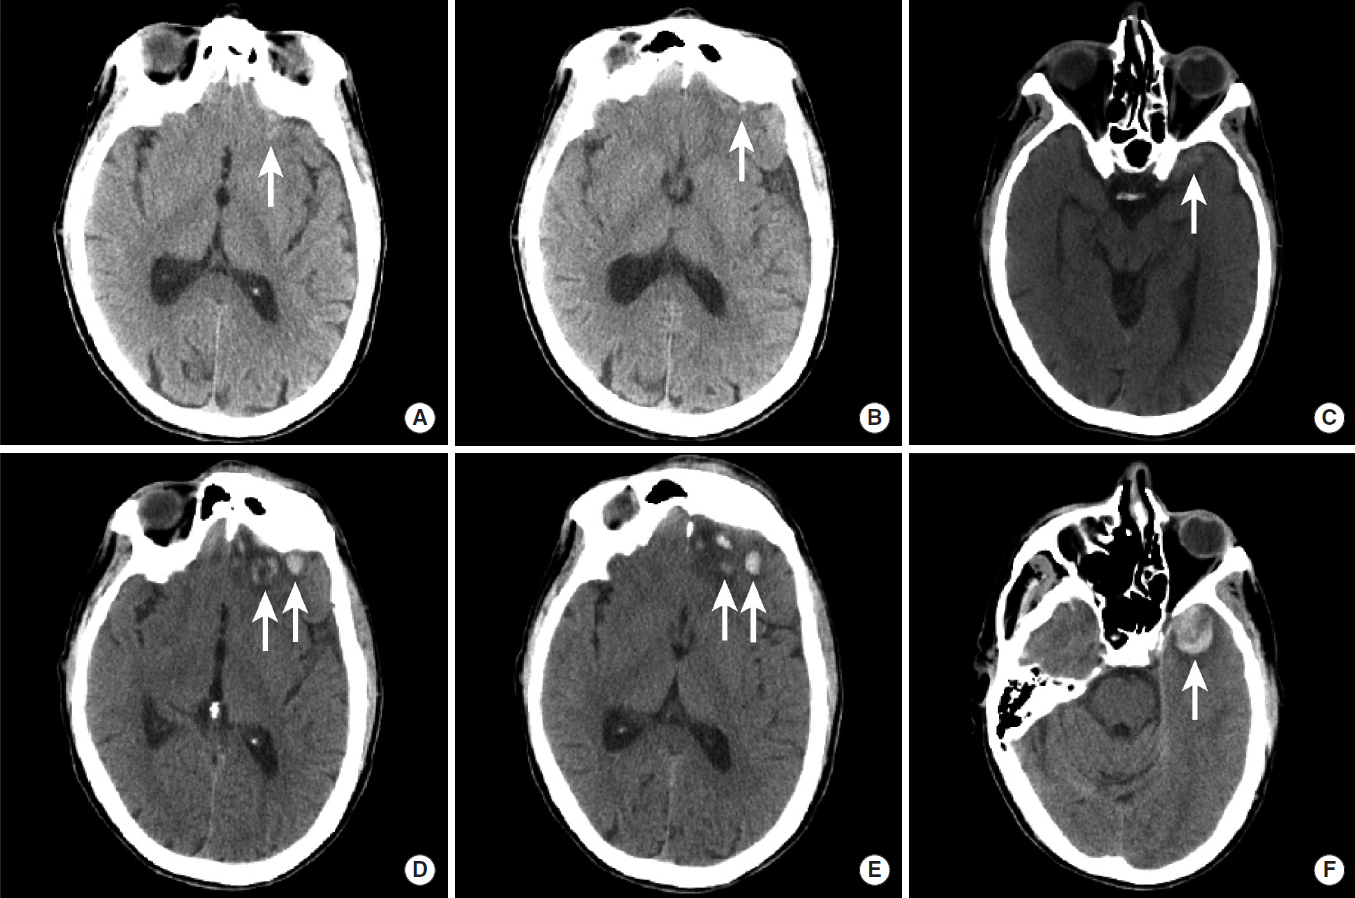
Interval growth of hemorrhagic parenchymal contusions. NCCT images in a patient with traumatic brain injury were obtained at the time of presentation to the hospital (A-C) and two hours later (D-F). Multiple small hemorrhagic contusions are present in the left orbital frontal gyrus (A, B, D, E, arrows) and in the left anterior temporal lobe (C, F, arrows). All of these contusions demonstrate significant interval growth on follow-up imaging (D-F). NCCT, non-contrast CT.
Cerebral microhemorrhage
Cerebral microhemorrhage represents a smaller form of post-traumatic hemorrhagic parenchymal contusion, and these microhemorrhages are typically centered in the white matter (Figure 5) [23]. These microhemorrhages are often occult on head CT, but are readily appreciated on GRE or SWI MRI sequences as foci of hypointense susceptibility blooming [23,24]. Cerebral microhemorrhages are associated with diffuse axonal injury and are often located near the gray-white matter junction [23]. The burden and distribution of cerebral microhemorrhage has been correlated to patient outcome, and is therefore an important marker of traumatic brain injury [25].
Intraparenchymal hemorrhage due to hypertension
Intraparenchymal hemorrhage (IPH) secondary to hypertension typically affects patients in their sixth and seventh decades of life and has a 30-50% mortality rate [26]. Acute IPH is identified by head CT as an intra-axial hyperdense region of hemorrhage that is classically centered within the basal ganglia, cerebellum, or occipital lobes (Figure 7). Non-traumatic IPH centered in the cerebral cortex should prompt consideration of diagnoses other than hypertension, as described in below. Similarly, IPH in patients younger than 50 should prompt consideration of other causes of bleeding such as an underlying brain neoplasm or vascular malformation. The initial hemorrhage may vary in size from a relatively small hematoma (less than 1-2 cm) without significant mass effect on the adjacent normal brain to very large hematomas with significant local mass effect and brain herniation. Non-contrast head CT (NCCT) characteristics are also predictive of patient outcome, and a worse prognosis is associated with the initial size of the hematoma [27,28], intraventricular extension of the hemorrhage [29-31], and expansion of the hematoma on serial imaging [32-34].

Spot sign in a hypertensive patient with a large intraparenchymal hemorrhage. NCCT images demonstrate a large hyperdense hemorrhage centered in the right basal ganglia (A, arrow). CTA images obtained in the arterial phase demonstrate a rounded area of contrast extravasation within the hematoma (“spot sign”) that is separate from any adjacent blood vessel (B, arrow). Delayed phase CTA image shows pooling of contrast in the same region (D, arrow) that represents active hemorrhage. NCCT, non-contrast CT; CTA, CT Angiography.
Serial head imaging by CT and/or MRI is commonly performed in patients with IPH to evaluate for interval expansion of the hematoma or evolving mass effect secondary to edema surrounding the hemorrhage, both of which may prompt changes in the patient’s management such as surgical decompression or evacuation [35,36].
There is an emerging role for CT Angiography (CTA) in the acute evaluation of IPH. CT images obtained as a delayed phase after performing CTA of the cerebral vessels may demonstrate active contrast extravasation as a hyperdense region of contrast pooling within the hematoma, which has been termed the “Spot Sign” (Figure 7) [37]. The presence of the Spot Sign predicts hematoma expansion and poor outcome, and this sign may therefore be used for both prognostication and to guide more aggressive medical or surgical intervention [35-38].
Additional diagnostic information may be obtained by CTA or MRI with contrast media about an underlying cause for the IPH. If clinical suspicion for an underlying neoplastic process is high, serial MRI with contrast may be performed once the hematoma has resolved to ensure that the hematoma does not obscure an underlying mass in the acute phase.
Intraparenchymal hemorrhage due to cerebral amyloid angiopathy
Cerebral amyloid angiopathy (CAA) results from amyloid-ß peptide deposition within cerebral arterial walls, and this deposition results in arterial wall weakening that may cause cerebral microhemorrhages, sulcal SAH, or larger cerebral IPHs. Sulcal SAH due to CAA is distinguished from vasculopathy or vasculitis etiologies by its presentation in patients older than 60, associated transient motor or sensation changes, and the presence of other associated areas of ICH as described below [7,39].
IPH secondary to CAA is often distinguished from IPH due to hypertension by several imaging characteristics. IPH due to CAA is typically centered in the white matter adjacent to the cerebral cortex and typically spares the basal ganglia, posterior fossa, and brainstem (Figure 8) [40,41]. A definitive diagnosis of CAA requires brain biopsy, but the Boston criteria may be used to determine the likelihood that IPH is secondary to CAA, and this criteria is based upon the number and distribution of cerebral hemorrhages and microhemorrhages [42].

Lobar hemorrhage due to cerebral amyloid angiopathy. NCCT (A), MRI GRE (B), and MRI SWI images (C) demonstrate intraparenchymal hemorrhage in the right temporal and occipital lobes (A, B, C, arrows). The pattern of hemorrhage is lobar and does not confine to an arterial vascular territory. The patient was eventually diagnosed with CAA. NCCT, non-contrast CT; MRI, magnetic resonance imaging; GRE, gradient-echo; SWI, susceptibility-weighted imaging; CAA, cerebral amyloid angiopathy.
IPH secondary to CAA is usually first identified by CT as a hyperdense intra-axial hemorrhage in the subcortical region. There may be prominent diffuse white matter hypoattentuation in both cerebral hemispheres that represents underlying microangiopathic changes, although this finding is not always present in patients with CAA [43,44]. A brain MRI may more strongly suggest the diagnosis of CAA by the presence of numerous small foci of susceptibility blooming in the bilateral cerebral white matter on GRE or SWI sequences (Figure 9) [42,44].

Spectrum of MR imaging findings in patients with cerebral amyloid angiopathy. MRI, including FLAIR (A, C) and GRE (B, D) sequences, was obtained in two patients with CAA. Patient 1 (A, B) demonstrates diffuse hyperintense signal abnormality throughout the cerebral white matter on FLAIR imaging (A, arrow) that corresponds to microangiopathic changes secondary to amyloid-ß peptide deposition in the arterial walls. In addition, evidence of prior microhemorrhage (B, arrowheads) and cortical (B, arrow) hemorrhage is demonstrated as hypointense signal abnormality. Patient 2 (C, D) demonstrates less prominent hyperintense signal abnormality in the perventricular cerebral white matter on FLAIR imaging (C, arrow), but multiple foci of prior microhemorrhage are present (D, arrowheads). MRI, magnetic resonance imaging; FLAIR, Fluid Attenuated Inversion Recovery; GRE, gradient-echo; CAA, cerebral amyloid angiopathy.
Cerebrovascular causes of intracranial hemorrhage
Non-traumatic cerebrovascular disease is another frequent cause of ICH. The appearance and distribution of ICH secondary to cerebrovascular lesions is diverse and depends upon the causative lesion and its location. Commonly encountered cerebrovascular causes of ICH include hemorrhagic conversion of ischemic infarction, aneurysms, arteriovenous malformations (AVMs), dural arteriovenous fistulae (DAVF), vasculitis or vasculopathy, mycotic aneurysms, and cortical venous or venous sinus thrombosis. These various forms of cerebrovascular ICH are discussed further below.
Hemorrhagic conversion of ischemic infarction
Ischemic infarction occurs secondary to thrombotic or thromboembolic blockage of a cerebral artery. The infarcted brain tissue is at risk of developing hemorrhagic conversion, which occurs in up to 43% of patients, and the risk of hemorrhagic conversion of an ischemic infarction is increased following intravenous or trans-arterial vessel recanalization [45-51]. There is a spectrum hemorrhagic transformation following ischemic infarction that is graded as: (1) petechial hemorrhage along the infarcted tissue margin (HI1), (2) confluent petechial hemorrhage within the infarcted tissue (HI2), (3) parenchymal hematoma involving 30% or less of the infarcted tissue with slight mass effect (PH1), (4) parenchymal hematoma involving greater than 30% of the infarcted tissue with significant mass effect (PH2) (Figure 10) [45,52]. Typically, only PH2 is clinically significant. The less severe HI1, HI2, and PH1 occur more commonly than PH2 [45].

Hemorrhagic conversion of ischemic stroke after endovascular revascularization. Acute ischemic infarction in the middle cerebral artery territory in four patients (columns) is identified as hypoattenuation within the right lentiform nucleus (A, arrow), restricted diffusion within the right caudate body (B, C, arrows), and restricted diffusion in the left caudate body (D, arrow). All four patients were successfully treated by endovascular therapy, but all developed hemorrhagic conversion of their infarctions on follow up GRE MRI. HI1 hemorrhage is shown as a punctate focus of susceptibility blooming in the right lentiform nucleus (E, arrow). HI2 hemorrhage is shown as confluent susceptibility blooming within the right lentiform nucleus (F, arrow). PH1 hemorrhage is present as hyperdensity with a fluid level within the right lentiform nucleus. PH2 hemorrhage is present as a large region of hyperdensity centered in the left basal ganglia with significant associated mass effect on the adjacent brain and left lateral ventricle.
Patients presenting with ischemic infarction often undergo serial neuroimaging studies to assess for hemorrhagic conversion and the development of post-infarction vasogenic edema. Patients who develop a decline in their neurologic status in the days following presentation with an ischemic stroke should undergo prompt brain imaging by CT or MRI to evaluate for the development of a symptomatic hemorrhagic conversion or worsening vasogenic edema that may require neurosurgical decompression (Figure 11). In patients who have undergone successful endovascular stroke treatment, reperfusion hemorrhage may be obscured by iodinated contrast “staining” from the cerebral angiogram that is frequency encountered in this patient population. Dual energy CT scanning has shown early promise in detecting regions of hemorrhagic transformation in this population, although this technique remains investigational at this time [53].

Hemorrhagic conversion of a left posterior inferior cerebellar artery territory infarction that required posterior fossa decompression surgery. Diffusion-weighted MRI demonstrates an acute stroke within the left posterior inferior cerebellar artery territory at the time of presentation (A). Three days later, the patient developed HI2 hemorrhage within the area of infarction (B, arrow) and swelling of the infarcted tissue that completely effaced the fourth ventricle (B, arrowhead). A suboccipital craniectomy (C, arrow) was performed with subsequent decompression of the fourth ventricle (C, arrowhead).
Cerebral aneurysms
Cerebral aneurysms are focal outpouchings arising from arteries coursing over the surface of the brain, and these outpouchings represent weakened areas of the arterial wall that are prone to rupture [54]. Cerebral aneurysm rupture classically presents as the sudden onset of the worst headache of a patient’s life, which is caused by hemorrhage into the subarachnoid space and associated irritation of the dura [54].
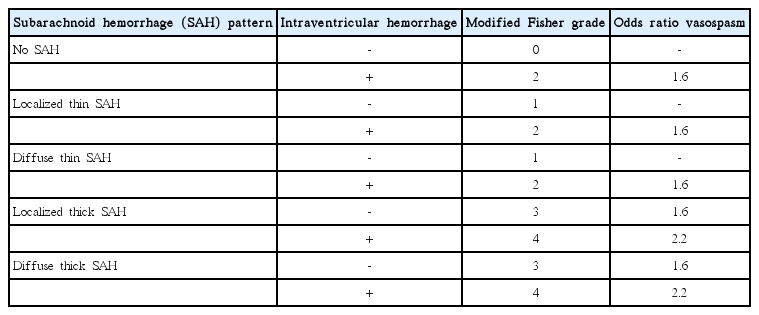
Head CT has a nearly 100% sensitivity for the presence of acute SAH in the first 6-24 hours following symptom onset [55]. SAH due to cerebral aneurysm rupture involves the basal cisterns, where the majority of cerebral aneurysms are located, and often extends diffusely throughout the subarachnoid space (Figure 12). The SAH may also extend into the ventricles and brain parenchyma itself depending upon the volume of hemorrhage and location of the ruptured aneurysm. The modified Fisher grade is commonly used to describe the volume and distribution of hemorrhage, and this scale predicts the probability of developing cerebral artery vasospasm after aneurysm rupture (Table 1) [56].

Diffuse subarachnoid hemorrhage following rupture of an anterior communicating artery aneurysm. NCCT shows diffuse SAH as hyperdensity within the basal cisterns (A, arrow). A CTA revealed a saccular aneurysm arising from the anterior communicating artery complex (B, arrow). A 3-dimensional angiogram during diagnostic cerebral angiography further characterizes this saccular aneurysm (C, arrow). NCCT, non-contrast CT; SAH, subarachnoid hemorrhage; CTA, CT Angiography.
Cerebral arteriovenous malformations
Cerebral AVMs are uncommon lesions that are characterized by abnormal arteriovenous shunting between cerebral arteries and veins through multiple small channels without the presence of an intervening capillary bed (termed the “nidus”) [57]. Cerebral AVMs are thought to be congenital or acquired shortly after birth and have a prevalence of 0.1% and an estimated 2-4% annual risk of ICH [57,58]. However, ICH is the most common presentation of a cerebral AVM [59-61].
Cerebral AVM rupture most commonly results in IPH, intraventricular hemorrhage (IVH), or SAH, which is identified by head CT in the acute setting as hyperdensity within these compartments (Figure 13) [62]. Cerebral AVM rupture occurs most commonly in young patients, and the presence of IPH, particularly in pediatric patients, should prompt strong consideration of this diagnosis. Cerebral AVMs may be identified by CTA, MRI with MR Angiography, or digital subtraction angiography (DSA). DSA should be performed in every patient presenting with a ruptured cerebral AVM to determine whether there is a nidal or perinidal aneurysm that may require emergent endovascular or surgical treatment to prevent a recurrent acute hemorrhage.

Intraparenchymal hemorrhage due to rupture of a small cerebral arteriovenous malformation in a pediatric patient. NCCT demonstrates a hyperdense intraparenchymal hemorrhage within the right frontal lobe (A, arrow), and maximum intensity projection images from a CTA demonstrate a tangle of vessels along the anterior margin of this hemorrhage (B, arrow). A cerebral DSA identified a small arteriovenous malformation (C, arrow) with a subtle early draining cortical vein (C, arrowhead). NCCT, non-contrast CT; CTA, CT Angiography; DSA, digital subtraction angiography.
Dural arteriovenous fistulae
DAVF are vascular lesions characterized by arteriovenous shunting secondary to direct fistulous connections between dural or cerebral arteries and the dural venous sinuses or cortical veins, and these lesions account for 10-15% of intracranial arteriovenous shunts [63-65]. In contrast to cerebral AVMs, DAVF lack a vascular nidus and are thought to be acquired lesions secondary to trauma or dural venous sinus thrombosis, but their etiology remains poorly understood [64,65]. The clinical presentation of DAVF is varied and includes headache, tinnitus, cranial nerve deficits, symptoms of increased intracranial pressure, or ICH [64,65].
Ruptured DAVF most commonly present with SAH or IPH, which is commonly detected in the acute setting by CT as hyperdense hemorrhage in these spaces (Figure 14). An underlying DAVF may be suggested on CTA by the presence of an increased number of vessels, which may be arteries or veins, which are commonly found near the major dural venous sinuses. The lack of temporal resolution on CTA limits the utility of this technique in the detection of DAVF, but a recent study suggests that time-resolved CTA may increase the sensitivity of this modality in the detection of DAVF [66].
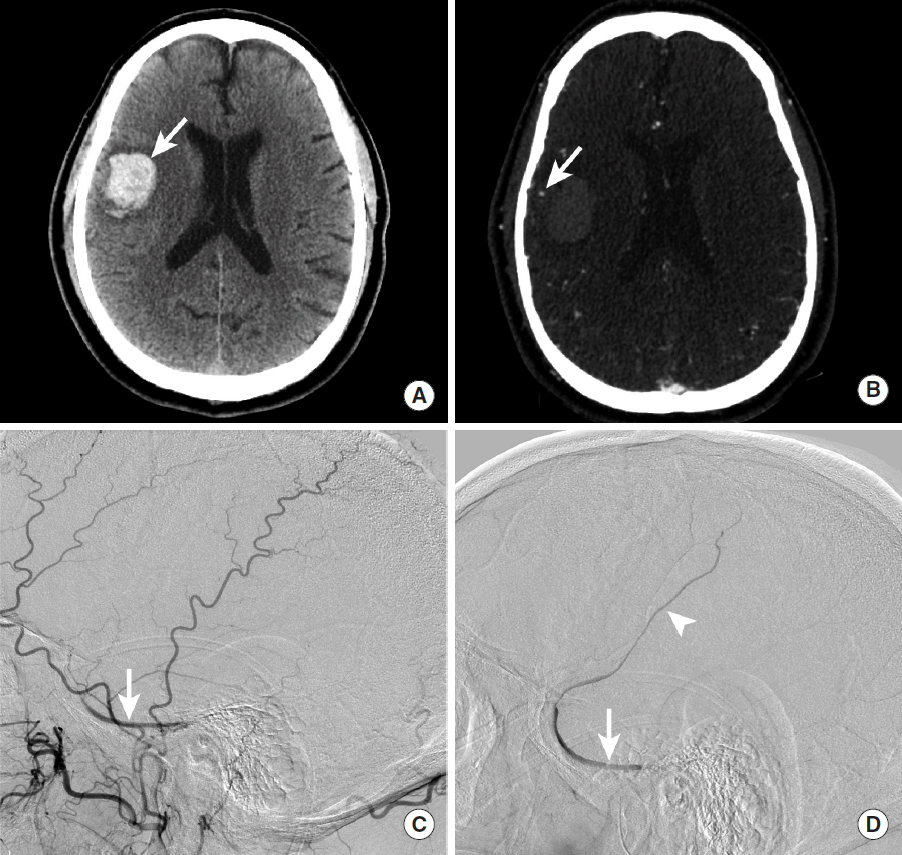
Intraparenchymal hemorrhage secondary to rupture of a dural arteriovenous fistula. NCCT shows a hyperdense intraparenchymal hemorrhage (A, arrow) within the inferior right temporal lobe. A CTA shows a prominent cortical vein overlying the region of hemorrhage (B, arrow). DSA (C, D) demonstrates contrast opacification of the right sphenoparietal sinus during the arterial phase (C, arrow) following injection of the right external carotid artery. More delayed DSA images demonstrate further retrograde filling of the right sphenoparietal sinus (D, arrow) and a cortical vein that courses superiorly (D, arrowhead); this cortical vein corresponds to the prominent vein identified on the CTA (B, arrow). NCCT, non-contrast CT; CTA, CT Angiography; DSA, digital subtraction angiography.
Increasingly, MRI is being performed for the detection and evaluation of DAVF. In particular, SWI and arterial spin label sequences have shown an excellent sensitivity for the detection of arteriovenous shunting, which suggests that MRI may be superior to CT and CTA in the detection of DAVF [67-72]. However, a direct comparison between MRI using these techniques with CTA has not been performed, to our knowledge.
The risk of DAVF rupture is based upon the pattern of venous outflow from the fistula [73,74]. The Cognard and Borden grading systems are commonly used to describe the risk of hemorrhage due to a DAVF, and the risk of hemorrhage relates to the venous egress of the fistula [73,74]. The arteriovenous shunting due to DAVF increases the pressure in the venous sinus, which may result in retrograde transmission of this increased pressure to cortical veins that drain into the sinus (Cognard IIB and IIA+IIB lesions) or into the cortical vein itself (Cognard III and IV lesions). Cortical veins that are unable to accommodate the increased pressure may rupture and cause ICH. Patients presenting with more severe symptoms are also more likely to develop DAVF rupture [73]. These grading systems are based upon DSA, which remains the gold standard in the evaluation of the angioarchitecture of these lesions. Advanced MRI techniques, such as arterial spin label, has been shown to be highly accurate in identifying the presence of a DAVF and in determining whether there is cortical venous reflux that should prompt treatment [71,72].
Cortical venous or venous sinus thrombosis
Dural venous sinus thrombosis (DVST) and/or cortical venous thrombosis is an uncommon and often clinically confusing entity, and imaging plays an essential role in determining this diagnosis. ICH secondary to DVST or cortical venous thrombosis most commonly presents with a headache, although symptoms of increased intracranial pressure or seizures are often encountered [75-77]. DVST is more common than cortical vein thrombosis, and the dural sinuses may become occluded secondary to skull base infections, dehydration, hypercoagulable states, and compression from meningiomas or other dural tumors [76,77]. ICH secondary to venous thrombosis typically does not follow an arterial distribution and is centered near the grey-white matter junction rather than the cortex (Figure 15) [77].
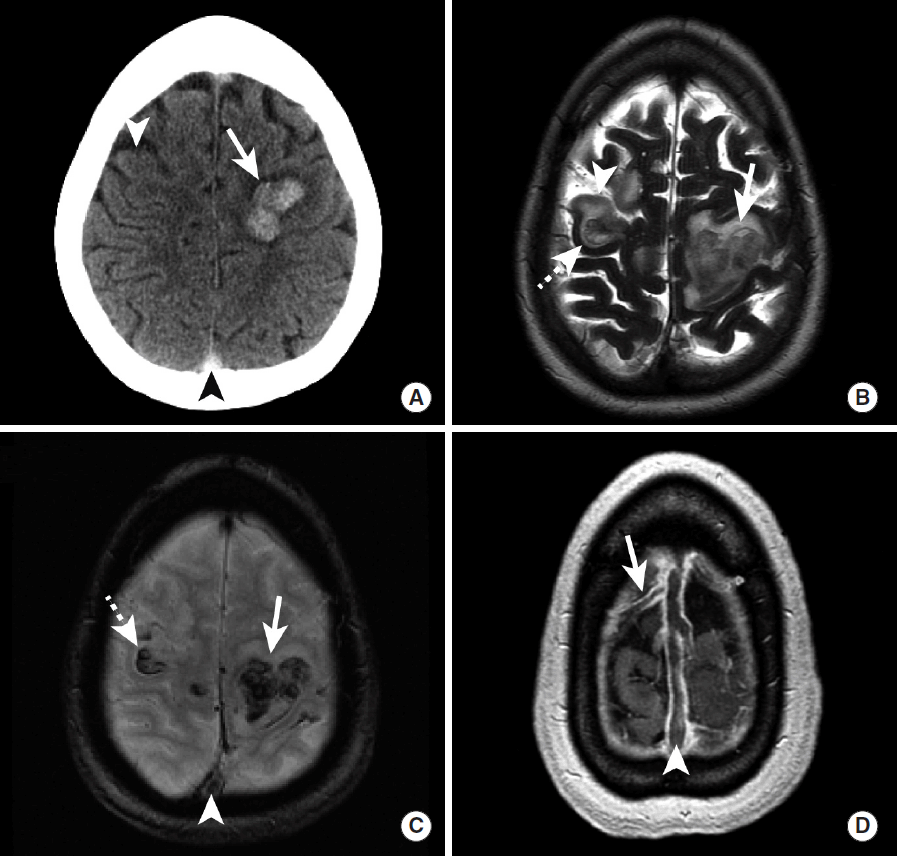
Intraparenchymal hemorrhage secondary to superior sagittal sinus thrombosis in a hypercoagulable female patient. NCCT (A) demonstrates hyperdense intraparenchymal hemorrhage in the posterior left superior and middle frontal gyri (A, arrow) and hypodense ischemic injury to the right middle frontal gyrus (A, arrowhead). MRI (B-D) further demonstrates intraparenchymal hemorrhage in the left superior and middle frontal gyri as heterogeneous T2 hypointense hemorrhage (B, arrow) and GRE hypointense signal (B, arrowhead) with surrounding T2 hyperintense edema. There is also intraparenchymal hemorrhage in the right middle frontal gyrus (B, dashed arrow) located posterior to a small area of ischemic infarction (B, arrowhead) that was identified on the prior head CT (A, arrowhead). GRE hypointense signal (C, arrowhead) and a filling defect on post-contrast volumetric MRI (D, arrowhead) identifies a filling defect in the superior sagittal sinus thrombosis that is the cause of this intracranial hemorrhage and ischemic injury. Additional thrombus is noted extending into an anterior right cortical vein on post-contrast volumetric imaging (D, arrow). NCCT, non-contrast CT; MRI, magnetic resonance imaging; GRE, gradient-echo.
After the identification of hyperdense parenchymal hemorrhage that does not conform to an arterial territory, DVST may be suggested by a hyperdense appearance of the major intracranial dural venous sinuses (Figure 15). Further evaluation by CT venography, MR venography, or volumetric post-gadolinium brain MRI is often necessary to make this diagnosis accurately (Figure 15). These additional studies will demonstrate the venous thrombosis as a filling defect within the affected venous structures (Figure 15) or a lack of signal within these structures on MR venography. Non-invasive vascular imaging may also be performed for follow up of DVST or cortical venous thrombosis after treatment by anticoagulation or endovascular venous thrombolysis.
Vasculitis or vasculopathy
Cerebral arterial vasculitis may present with headaches, behavioral changes, neurologic deficits, or ICH [78]. Sulcal SAH near the cerebral convexity is the most common form of ICH caused by vasculitis or vasculopathy [7,79]. Acute sulcal SAH due to vasculitis or vasculopathy is most commonly identified by head CT as hyperdensity within the cerebral sulci, but it may also be identified by MRI as sulcal hyperintensity on FLAIR sequences or hypointense signal abnormality on GRE or SWI sequences (Figure 16). Sulcal SAH in the absence of trauma should be evaluated further by DSA, especially in the setting of a negative CTA, to ensure that the diagnosis of vasculitis or vasculopathy is made correctly [79].
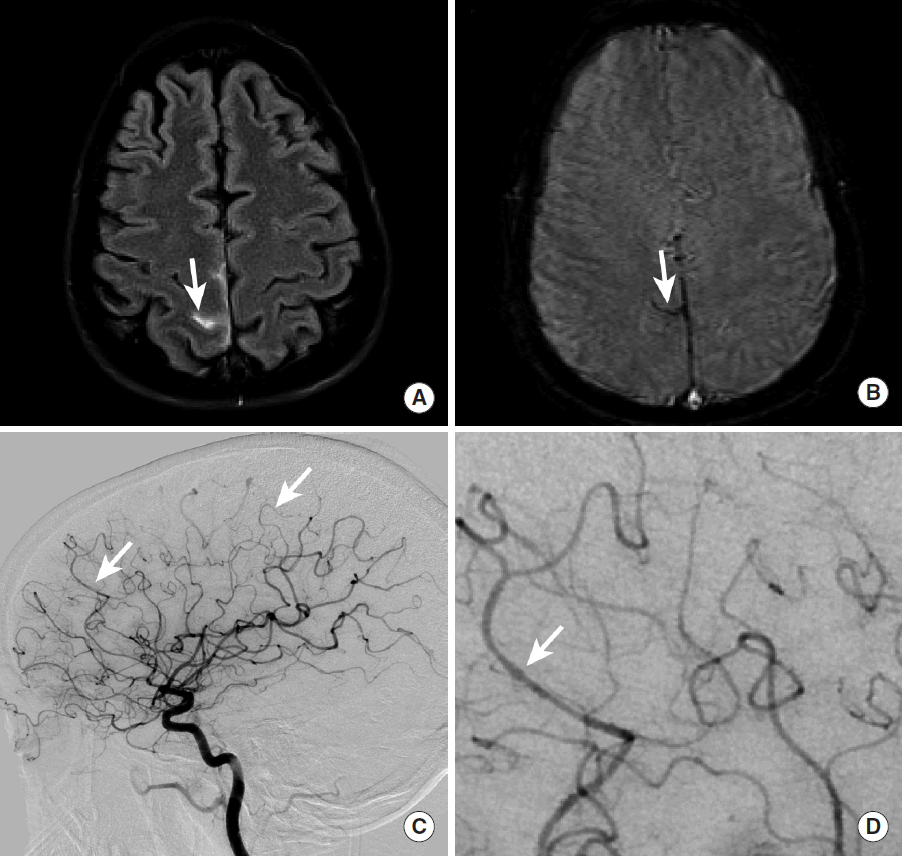
Sulcal subarachnoid hemorrhage secondary to cerebral arterial vasculitis. A middle-aged female patient presented with a headache. MRI FLAIR imaging demonstrates abnormal hyperintense signal within the right marginal sulcus (A, arrow), and MRI GRE imaging demonstrates abnormal hypointense signal within the right marginal sulcus more inferiorly (B, arrow). A cerebral DSA (C, D) demonstrates subtle beading within the M4 segments of the right middle cerebral artery (C, D, arrows) and distal right anterior cerebral artery (not shown) that was consistent with vasculitis. MRI, magnetic resonance imaging; FLAIR, Fluid Attenuated Inversion Recovery; GRE, gradient-echo; DSA, digital subtraction angiography.
Mycotic aneurysms
Mycotic aneurysms are arterial outpouchings that typically arise from distal cerebral arteries. These lesions are actually pseudo-aneurysms, and they are commonly caused by distal vessel thromboembolic occlusion with associated inflammatory changes that result in small tears at the site of vessel occlusion [80,81]. Mycotic aneurysms are typically caused by endocarditis or thrombi related to mechanical cardiac valves and other cardiac anomalies [80-82].
Similar to vasculitis, rupture of a mycotic aneurysm may also result in sulcal SAH, which is identified in the acute phase as hyperdensity within the cerebral sulci, often near the vertex. Mycotic aneurysms arising from the more proximal intracranial vessels may present with a diffuse pattern of SAH [82]. Mycotic aneurysms may appear as foci of hypointensity in the subarachnoid space or near the grey-white matter junction on GRE MRI sequences (Figure 17). Vascular imaging by CTA or MR Angiography may demonstrate a subtle arterial outpouching or, more commonly, a focal increase in caliber of the affected vessel. However, small mycotic aneurysms may be occult on non-invasive vascular imaging, and DSA should be performed to identify and characterize these lesions and to identify any other associated mycotic aneurysms that are unruptured (Figure 17).

Sulcal subarachnoid hemorrhage secondary to rupture of a right middle cerebral artery mycotic aneurysm. MRI (A-C) identifies sulcal SAH as hyperintense signal abnormality on the FLAIR sequence (A, arrow) and hypointense signal abnormality on the GRE sequence (B, arrow) within the left precentral sulcu. A post contrast volumetric image demonstrates a rounded area of enhancement along the course of the vessels within the left precentral sulcus (C, arrow) that represents a mycotic aneurysm. Cerebral DSA in the anteroposterior (D) and lateral (E, F) projections demonstrate a lobulated mycotic aneurysm arising from the left precentral artery (D-F, arrows). This mycotic aneurysm is best appreciated on the lateral magnified view (F, arrow). MRI, magnetic resonance imaging; SAH, subarachnoid hemorrhage; FLAIR, Fluid Attenuated Inversion Recovery; GRE, gradient-echo; DSA, digital subtraction angiography.
Conclusion
ICH is a significant medical event with a high mortality. There is wide variation in the imaging appearance of ICH, which reflects the wide diversity of pathology that results in ICH. Careful consideration of the pattern of ICH, patient symptoms and demographics, and associated vascular or post-contrast imaging may reveal the diagnosis in most situations.
Notes
The authors have no financial conflicts of interest.
