Prediction of Upper Limb Motor Recovery after Subacute Ischemic Stroke Using Diffusion Tensor Imaging: A Systematic Review and Meta-Analysis
Article information
Abstract
Early evaluation of the pyramidal tract using Diffusion Tensor Imaging (DTI) is a prerequisite to decide the optimal treatment or to assess appropriate rehabilitation. The early predictive value of DTI for assessing motor and functional recovery in ischemic stroke (IS) has yielded contradictory results. The purpose is to systematically review and summarize the current available literature on the value of Fractional Anisotropy (FA) parameter of the DTI in predicting upper limb motor recovery after sub-acute IS. MEDLINE, PubMed, EMBASE, Google Scholar and Cochrane CENTRAL searches were conducted from January 1, 1950, to July 31, 2015, which was supplemented with relevant articles identified in the references. Correlation between FA and upper limb motor recovery measure was done. Heterogeneity was examined using Higgins I-squared, Tau-squared. Summary of correlation coefficient was determined using Random Effects model. Out of 166 citations, only eleven studies met the criteria for inclusion in the systematic review and six studies were included in the meta-analysis. A random effects model revealed that DTI parameter FA is a significant predictor for upper limb motor recovery after sub-acute IS [Correlation Coefficient=0.82; 95% Confidence Interval-0.66 to 0.90, P value<0.001]. Moderate heterogeneity was observed (Tau-squared=0.12, I-squared=62.14). The studies reported so far on correlation between DTI and upper limb motor recovery are few with small sample sizes. This meta-analysis suggests strong correlation between DTI parameter FA and upper limb motor recovery. Well-designed prospective trials embedded with larger sample size are required to establish these findings.
Introduction
Stroke is a major leading cause of death and disability worldwide especially in the elderly population [1]. Upper limb motor weakness is one of the most frequent complications after stroke with over 50% of stroke patients experiencing residual motor deficit [2]. Despite advances in treatment of acute ischemic stroke (IS) and post-stroke rehabilitation, the dependency rate after stroke still reaches 20%-30% [3]. Prognostication of upper limb motor outcomes after stroke is an important for specific rehabilitation strategies and final motor outcomes but, considered a difficult task. Many studies have tried to predict motor outcome in hemiparetic stroke patients using clinical findings [4,5], electrophysiological methods [6,7], and functional neuroimaging [8,9]. However, these studies have an inherent weakness that they were unable to visualize the corticospinal tract (CST), the most important structure for motor control, especially for fine motor control of the hand in humans [10].
Diffusion tensor imaging (DTI) is an advance non-invasive magnetic resonance imaging technique used to characterize the orientation properties of diffusion process of water molecules. DTI has a unique advantage in visualization and estimation of CST which is the most important neural tract for mainly upper limb motor function [11]. DTI permits the imaging of axonal pathways of the living brain and provides information about tissue microstructure by measuring fractional anisotropy (FA) [12]. FA is an index of the diffusion characteristics of water molecules preferentially directed along the axis of major axonal pathways. FA of the entire tract, acquired early after stroke, reflect acute and permanent damage to pyramidal tracts to determine clinical motor deficit and outcome. A tissue is considered to be fully isotropic when its FA is equal to 0, and fully anisotropic when its FA is equal to 1 [13].
Over the past two decades, numerous cross-sectional DTI studies have examined the relationships between age and the degree of anisotropy FA in white matter tracts [14]. Cross-sectional studies have demonstrated that older adults display lower FA values and higher mean diffusivity and radial diffusivity values compared with younger adults [15,16], with age correlations relatively weak during adulthood and stronger in senescence [17,18]. Currently, the most widely used invariant measure of anisotropy is FA described originally by Basser and Pierpaoli [12]. In the parametric data obtained from DTI, taking advantage of the much larger FA values of highly directional white matter structures, FA images are used to distinguish white matter and non-white matter tissues [19]. Studies that have examined small homogeneous samples of subcortical stroke patients have found that large asymmetries in FA are associated with poorer motor recovery [20,21]. Findings from recent studies have demonstrated the predictive value of DTI for motor outcome after stroke [22,23], however, it is not yet used routinely to make a prognosis but there have been some interesting recent developments in this area. Therefore, the purpose of this review is to establish the predictive value of DTI for upper limb motor recovery in IS patients.
Methods
Search strategy
MEDLINE, PubMed, EMBASE, Google Scholar and Cochrane CENTRAL searches were conducted from January 1, 1950, to July 31, 2015. The search terms were “diffusion tensor imaging,” “motor recovery” and “upper limb” combined with “ischemic stroke.” Manual searches of the reference lists of retrieved articles and pertinent reviews were also conducted. No language restrictions were imposed. Referred list of studies found was also searched. The studies were selected if they included patients of IS with upper limb motor deficit, had DTI done and measurement of clinical recovery on follow-up.
Inclusion Criteria: (a) Full published article, (b) Observational study that investigated a DTI parameter (FA) measured at baseline and its relationship with a measure of upper limb recovery measured at a future time point, (c) The study population included individuals with upper limb deficits following IS, (d) Outcomes included upper limb function/functional recovery.
Exclusion Criteria: (a) No extractable data (Correlation Co-efficient) was available for independent variables, (b) case-reports or review articles, (c) studies which included patients who were in the chronic phase (inclusion of patients more than one month of IS onset).
Data extraction
According to the Preferred reporting items for systematic review and meta-analysis guidance [24], two authors independently (Pradeep Kumar and Prachi Kathuria) searched and evaluated the literature for inclusion of studies based on the titles and abstracts/full papers. We extracted the following data from eligible studies: surname of first author, year of publication, number of participants, Mean age, sex ratio, lesion location, hemisphere affected, time of inclusion, clinical scale used, DTI parameters, duration of follow up. The imaging parameters such as acquisition matrix, echo time, repetition time, field of view, b-value, number of slices, FA threshold, FA angle, analysis software, region of interest selection area, and FA values was also extracted. All discrepancies were resolved after rechecking the source papers and further discussion among all the authors.
Quality assessment
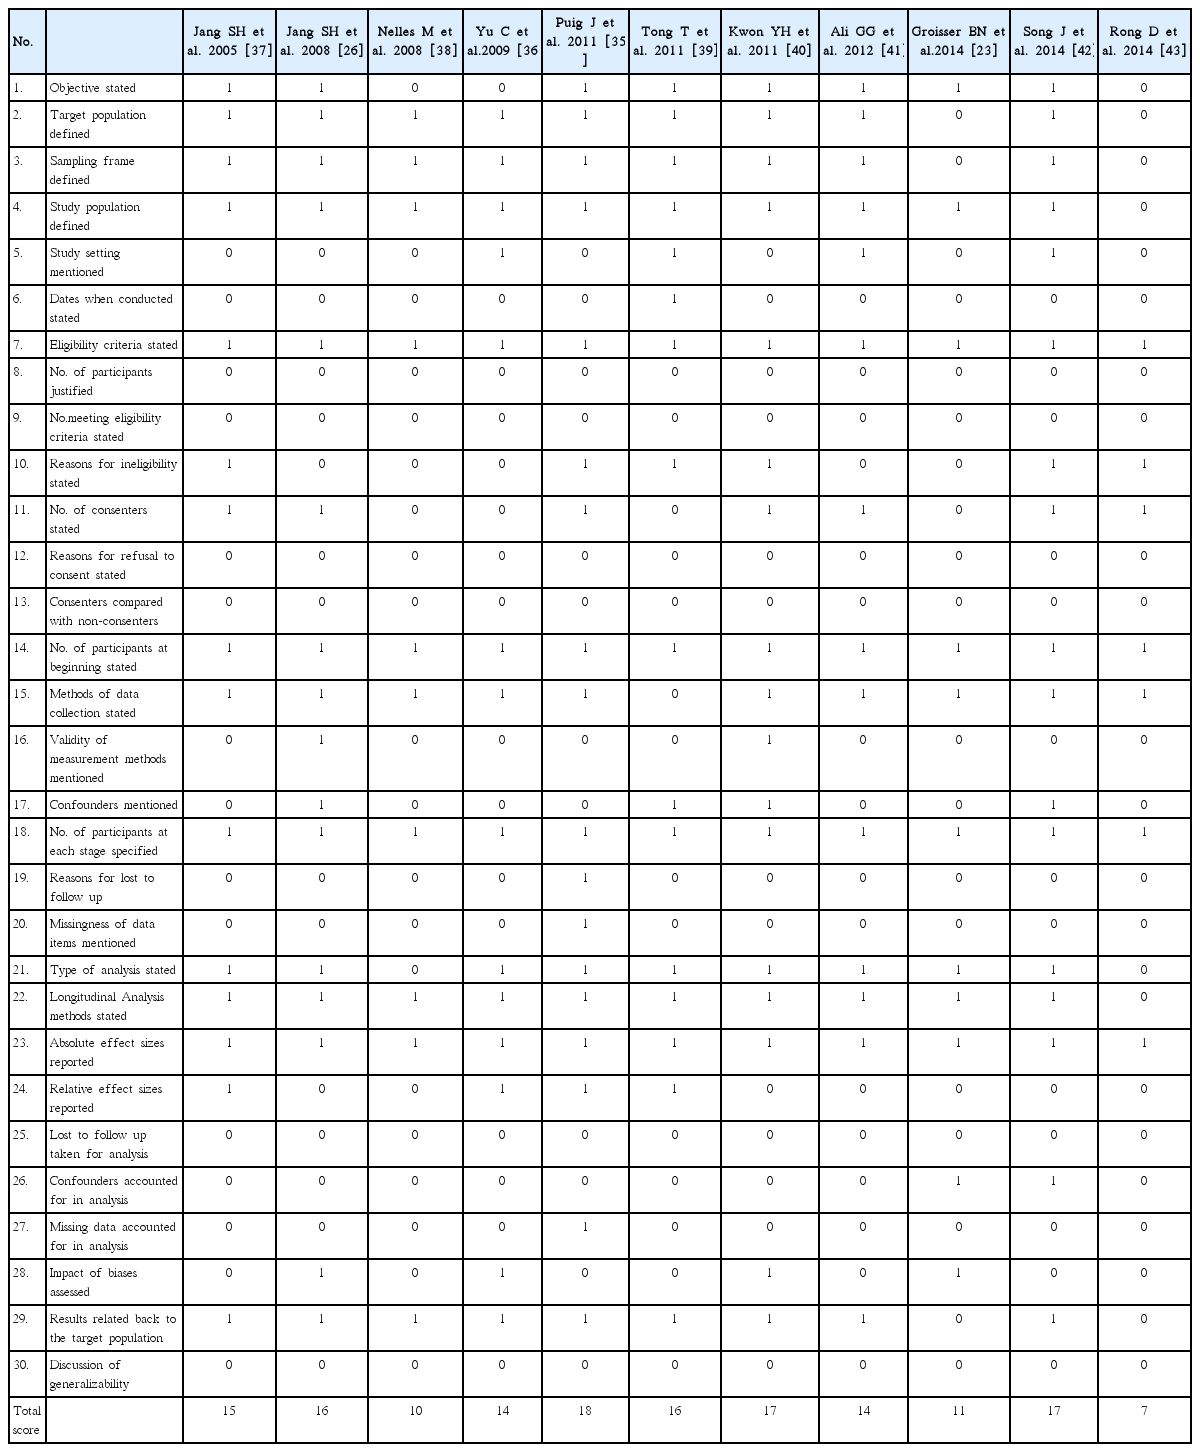
To evaluate the methodological quality of included studies, checklist provided by Tooth et al. [25] was used and focused on the basic elements of quality assessment. The quality of each study was assessed according whether information was provided regarding 30 items present in the list. The methodological assessment was done independently by two authors (Pradeep Kumar and Prachi Kathuria) and the disagreements were resolved by discussion by all the authors. Assessment were expressed in terms of “Yes” if description was available and “No” if the description was not available. The scores of quality assessment of all characteristics were out of 30, Yes was given score “1” and No was given score “0.” This quality assessment method records the numbers, and reasons for, eligibility, consent, participation in each wave, and attrition. These main elements were chosen because they provide information at a glance on probable selection-driven threats to internal and external validity.
Statistical analysis
The correlation between FA and upper limb motor recovery measure was done using Comprehensive Meta-Analysis Version-3 computer software. The correlation coefficient and the sample size for each study were used to determine the same. For one study Jang et al. [26] correlation coefficient was calculated from individual patient data provided in the paper. The data for IS patients with lesion location in Corona radiata (n = 14) and internal capsule (n = 6) was used for this calculation. There was no duplication of patient’s data while performing the analysis. Heterogeneity was examined using Higgins I-squared., Tau-squared. Summary correlation coefficient was determined using Random Effects model.
Results
Identification of relevant studies
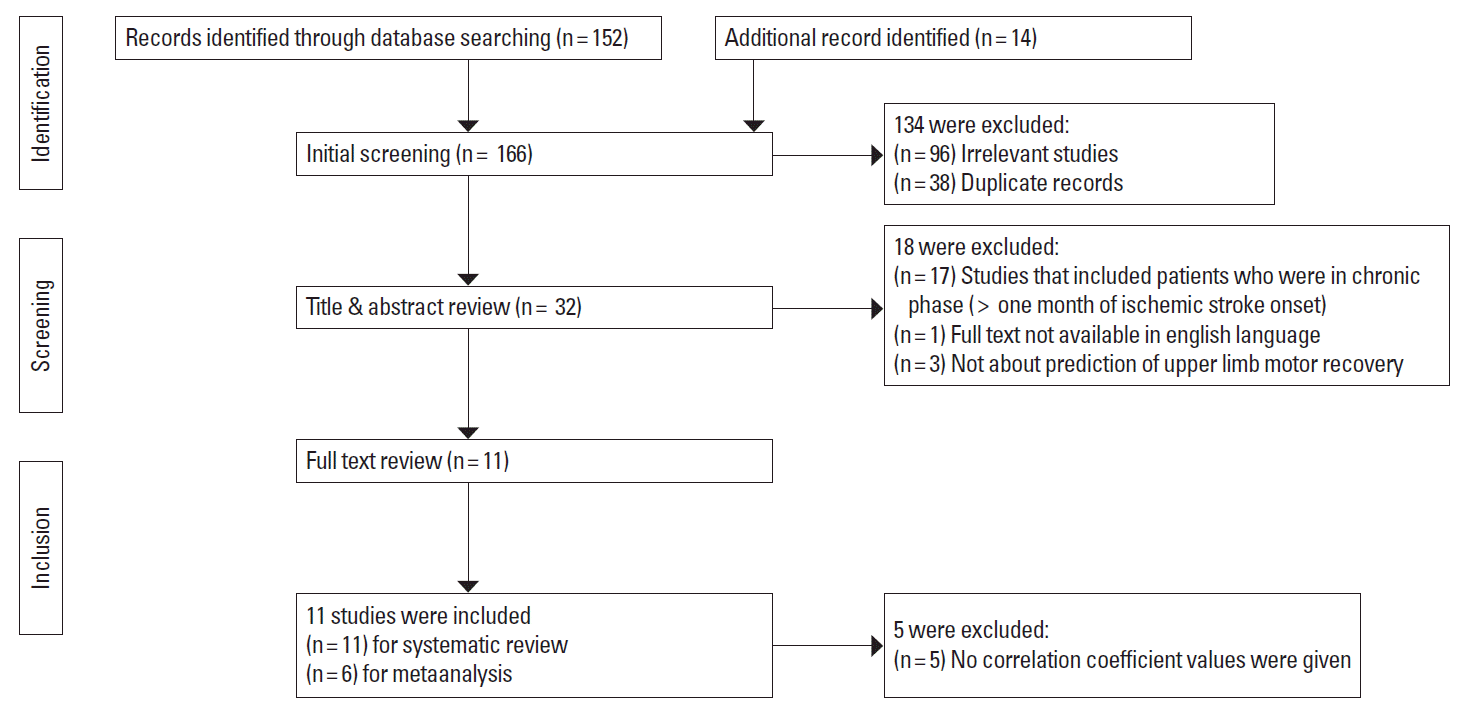
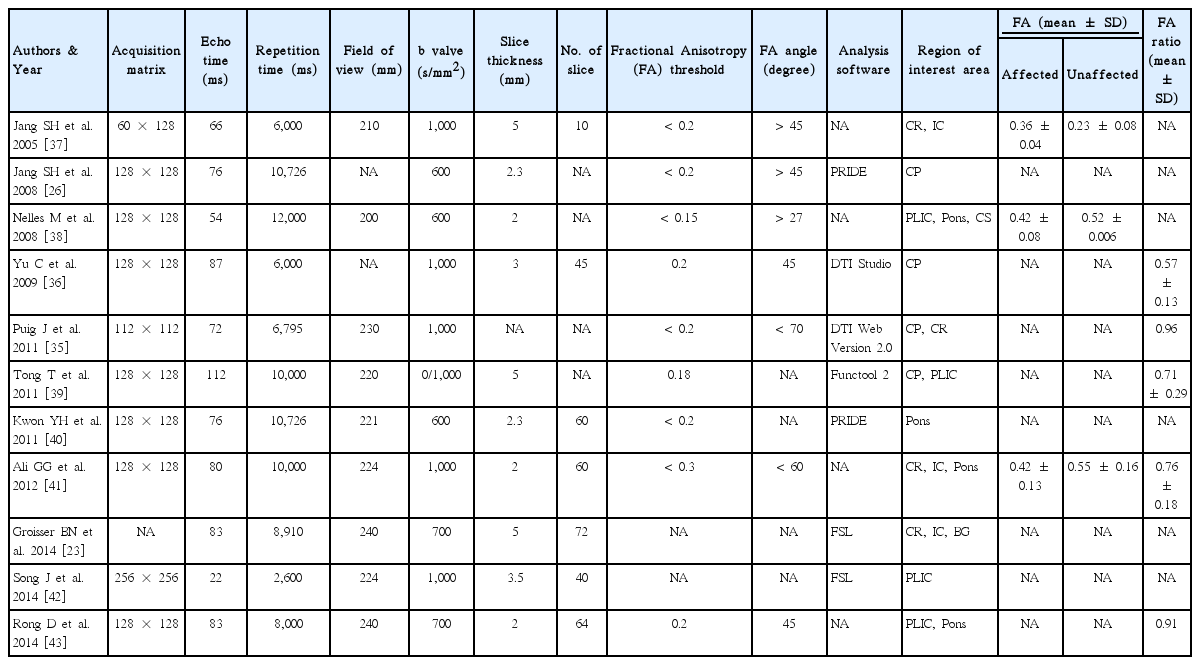
A total of 166 published articles were identified using the pre-specified search strategy. Figure 1 represents a flow chart of retrieved and excluded studies with their reasons for exclusion. Out of 166 retrieved articles, 98 were irrelevant studies, 36 were in duplicate records, 17 studies were excluded due to studies which included patients who were in chronic phase (more than one month of IS onset), 3 studies were excluded as they were not about the prediction of upper limb motor recovery and 1 studies were excluded as full text was not available in english language. Finally, total 11 studies were included for the systematic review and 6 studies were included for the meta-analysis. The general characteristics of the included studies and relative methodological details, results and imaging parameters are presented in Tables 1 and 2.

Flow diagram of the selection of studies and specific reasons for exclusion from the present meta-analysis.
Characteristics of studies
Eleven studies included a total of 273 patients with subacute IS. The sample sizes ranged from 3 to 60 participants. Ten studies included only IS patients; one included both IS and haemorrhagic stroke patients (only data for IS was used). The Imaging measurement parameters reported were FA, Apparent Diffusion Coefficient, Infarct Volume, Lesion Volume and Diffusion Tensor Tractography. There emerged discrepancies in terms of lesion location DTI evaluation in the included studies. The studies also used a wide range of scales to measure the clinical outcome or outcome measures such as National Institutes of Health Stroke Scale (5/11) was the most commonly used , the other scales used were Barthel index scale (1/11), Modified Rankin Scale (1/11), Medical Research Council (2/11), Functional Ambulation Classification (1/11) , Motricity Index (3/11), and Modified Brunstrom Scale (2/11). The follow-up periods ranged from 20 days to 1 year (Table 1). The imaging parameters of the included studies have been shown in Table 2.
Methodological quality
Table 3 shows the quality assessment results for the included studies. There was 90% agreement between the two authors. All studies described the study population, the eligibility criteria, number of patients in the beginning, and absolute effect sizes. All the studies also reported the longitudinal analysis methods and the number of participants at each stage of the study. The quality score ranges from 7 to 18. The results were related back to the target population by all the studies. Eight out of eleven studies described the methods of data collection and type of analysis done. Only one study reported reasons for loss to follow up. However, loss to follow up and confounders were not taken into account at the time of analysis in any of the studies. Three studies assessed the impact of biases on the analysis. Three studies reported the confounders in the study and only one study explained about the missingness of data items.
Meta-analysis
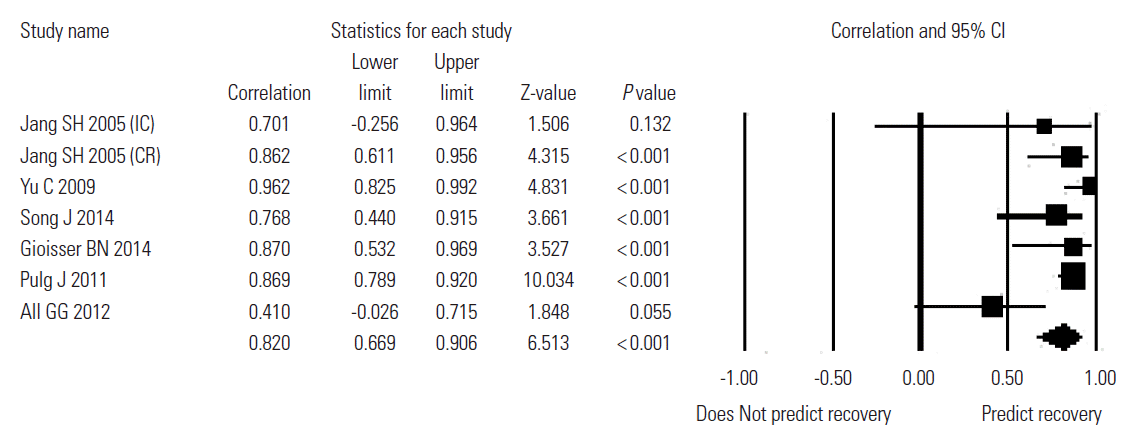
The results of the meta-analysis are presented in Figure 2 using Random effects model. Out of eleven studies six studies provided data to allow determination of summary correlation coefficient. A random effects model revealed that DTI parameter FA is significant predictor for upper limb motor recovery after sub-acute IS [Correlation Coefficient = 0.82; 95% Confidence Interval-0.66 to 0.90, P value < 0.001]. There was moderate heterogeneity (Tau-squared = 0.12, I-squared = 62.14).
Discussion
In this study, we reviewed relevant studies on prediction of upper limb motor recovery outcome in sub-acute IS patients to determine whether the integrity of the CST, as determined by DTI parameter FA obtained during the early stage of IS, can predicts the upper limb motor recovery. The present meta-analysis showed a significant correlation between DTI parameter FA and upper limb motor recovery in IS patients. A method to reliably predict upper limb recovery would help to optimize rehabilitation, to inform patients about prognosis and to design clinical trials to identify appropriate interventions.
By virtue of its capacity for visualization of water diffusion characteristics, DTI allows for determination of the orientation and integrity of white matter tracts [27]. In normal white matter, water molecules have relative freedom of movement in a direction parallel to that of the nerve fiber tracts; however, their movements are restricted across the tracts, which causes diffusion anisotropy of white matter [28,29]. FA has been used for evaluation of the extent of fiber damage in diseases that affect the white matter, such as those of the CST [30,31]. Therefore, DTI seems to have an advantage in prediction of the motor prognoses of stroke patients because it makes assessment of the spatial relationship between a subcortical lesion and a neural tract possible. The use of DTI FA measures, in combination with other quantitative imaging modalities (e.g. spectroscopy, perfusion) may help to improve the specificity of tissue pathology. The advancement of tools for tractography, image segmentation and co-registration (between subject normalization) and anatomical templates will help to improve anatomic specificity of DTI characterization in both clinical and research settings [32].
For patients in whom transcranial magnetic stimulation fails to elicit responses in the affected upper limb, DTI provides a useful measure of CST integrity. Those patients with FA asymmetry of < 0.25 have greater functional potential, and are more likely to lateralize cortical activity towards the ipsilesional motor cortex during affected upper limb use. This ipsilesional lateralization may be enhanced by interventions designed to increase the excitability and plasticity of the ipsilesional cortex. Priming the ipsilesional cortex, as an adjuvant therapy, may improve functional outcomes in this group [33,34]. Patients without motor evoked potential responses to transcranial magnetic stimulation in the affected upper limb, and FA asymmetry of > 0.25, are likely to have low functional potential and poor recovery of upper limb function [21]. The degree of impairment in FA during the early stages of stroke appears to have the potential to predict motor outcome [29,35,36].
The studies included in the meta-analysis reported heterogeneous data, which could be a major limitation to our results. The assessment parameters differ for included study in the analysis e.g., motor outcome assessment scales. The region of interest selection technique is operator-dependent which may have also affected the results. If we discuss on technical grounds, DTI may underestimate the fiber tracts than electrophysiological test. DTI is a powerful anatomic imaging tool that can demonstrate the gross fiber architecture, but not the functional or synaptic connections. Therefore, major fiber bundles such as the CST can be the real fiber pathways on DTI, relaying fibers cannot be depicted with DTI. Although FA is likely to be adequate for many applications and appears to be quite sensitive to a broad spectrum of pathological conditions, the full tensor shape cannot be simply described using a single scalar measure. As it does not describe the full tensor shape or distribution. This is because different Eigen value combinations can generate the same values of FA. However, the tensor shape can be described completely using a combination of spherical, linear and planar shape measures. In particular, FA is highly sensitive to micro-structural changes, but not very specific to the type of changes (e.g., radial or axial) [32]. Moreover there are various analysis techniques such as streamline and probabilistic techniques. Streamline method provide a single estimate of a virtual fiber track without incorporating the uncertainty introduced by noise; whereas probabilistic methods attempt to address this limitation by providing a confidence measure. Streamline method generates a unique virtual fiber track, whereas probabilistic method produces an arbitrary number of virtual fiber tracks that are reconstructed.
Therefore, combined studies using other brain mapping techniques, such as transcranial magnetic stimulation or functional magnetic resonance imaging, would be necessary to compensate for the limitations of DTI. The advantages of each of the methods for evaluation of a neural tract allow more accurate estimation when they are employed concomitantly, because combination can compensate for the limitations of a certain evaluation method and more accurate information can be obtained the most ideal evaluation method for assessment of the CST would be capable of: 1) obtaining information about the integrity and course of the CST and quantification of the CST at the subcortical level using DTI with diffusion tensor tractography; 2) obtaining information on the origin of the CST at the cortical level using functional Magnetic Resonance Imaging (fMRI) and 3) obtaining information on the quantification and characteristics of the CST using motor evoked potential determined by transcranial magnetic stimulation. However, further improvements in the technique and in post processing analysis are needed to increase the widespread utility of DTI in both research and clinical applications.
Conclusion
In the acute and sub-acute phase there is an unexplained variability in the extent to which patients recover after stroke. DTI has emerged as a promising tool for CST integrity mapping to predict upper limb motor outcome. The studies reported so far on correlation between DTI and upper limb motor recovery are few with small sample sizes. The meta-analysis suggests strong correlation between DTI parameters FA and upper limb motor recovery in acute IS patients. More studies with larger sample sizes are required to establish these findings.
Notes
The authors have no financial conflicts of interest.


