High Daily Diastolic Blood Pressure Predicts Incident Stroke, Lacune, and Cerebral Microbleeds in CADASIL
Article information

Dear Sir:
In general, elevated levels of systolic and diastolic blood pressure (BP), as well as increased BP variability, are associated with increased burden and progression of cerebral small vessel disease (CSVD) [1,2]. Cerebral autosomal dominant arteriopathy with subcortical infarcts and leukoencephalopathy (CADASIL), a hereditary form of CSVD resulting from the NOTCH3 mutation, can manifest and progress independently of hypertension [3]. However, concurrent hypertension in CADASIL is associated with an augmented risk of stroke and can worsen disease severity, as evidenced by neuroimaging markers such as brain atrophy, microhemorrhages, and impaired white matter integrity [4-6]. However, currently there are no disease-modifying therapies available for CADASIL, and the extent to which daily BP variations or levels can influence the disease course in CADASIL, even in the absence of arterial hypertension, remains unclear. Therefore, we hypothesized that close BP monitoring and aggressive BP control have the potential to aid in the identification of predictors of disease progression in CADASIL. This study aimed to investigate whether various parameters derived from daily home-based automated BP measurements, such as the mean and variability of daily BP, could enhance the prediction of clinical or neuroimaging progression of CADASIL.
Study participants were recruited from the prospective Taiwan CADASIL Registry cohort, which enrolled patients with genetically confirmed cysteine-altering NOTCH3 variants. The detailed methodology can be found in the Supplementary Methods. Briefly, each enrolled patient was provided with an automated home-based sphygmomanometer (BP A2 Easy; Microlife AG, Widnau, Switzerland) to record BP for at least 90 consecutive days. Patients and their caregivers recorded systolic BP (SBP) and diastolic BP (DBP) twice daily. The mean and standard deviation (SD) of SBP, DBP, and pulse pressure (PP) were used in the analysis. Systolic hypertension was defined as a mean SBP >130 mm Hg and diastolic hypertension as a DBP >80 mm Hg. Patients with available BP records for <50% of the days were excluded.
All patients underwent 1.5-T brain magnetic resonance imaging (MRI) upon enrollment. Follow-up MRIs were performed at intervals of 1–2 years. Visual rating analyses of CSVD markers were performed in accordance with the STandards for ReportIng Vascular changes on nEuroimaging (i.e., STRIVE) criteria, which included white matter hyperintensity, enlarged perivascular space, number of lacunes, and cerebral microbleeds (CMBs) [7]. Quantitative analyses of MRI lesions included mean cortical thickness, brain parenchymal fraction, and white matter lesion (WML) volume.
The clinical outcome was stroke incidence. Any incident stroke event was documented and defined as an acute episode of focal neurological dysfunction lasting more than 24 hours with corresponding neuroimaging evidence of cerebral infarction or hemorrhage. The neuroimaging outcome was the progression of MRI markers between baseline and follow-up scans. Because the median annual increases in the number of lacunes and CMBs were 0 and 1, respectively, any incident lacunes or increased CMB numbers ≥2 per year were defined as meaningful neuroimaging outcomes. A Cox regression model was used to test the influence of BP parameters on incident stroke, while logistic regression models were applied for BP parameters and any incident lacune or incident CMB ≥2 per year. Furthermore, a linear mixed model was used to test the associations between changes in neuroimaging markers and each BP parameter.
Of the 128 CADASIL patients with available BP records, 6 were excluded due to <50% of BP records and 31 were excluded due to lack of follow-up MRI, mainly because the follow-up period was too short for the scheduled second MRI. Of the remaining 91 patients (age, 63.2±10.5 years; 65% male), 56% had a history of hypertension and 60% had a history of stroke (Supplementary Table 1). Most of the patients (n=81) carried the NOTCH3 variant R544C, which is the predominant variant in Taiwan. The others included: one with R110C, one with S118C, two with R131C, one with R141C, two with R332C, one with R1231C, and two with C1250R. The 90-day mean SBP and DBP were 119.3±10.6 mm Hg and 73.6±7.9 mm Hg; 15% and 19% of the patients had systolic or diastolic hypertension, respectively. The median changes in CSVD markers on MRI are shown in Supplementary Table 2. Comparisons between patients with NOTCH3 R544C and non-R544C variants are presented in Supplementary Table 3.
During a median follow-up of 2.5 years (interquartile range [IQR], 1.8–3.6), there were nine incident stroke events (six ischemic and three hemorrhagic). The mean SBP, DBP, and PP were not significantly different between patients with and without incident stroke (Figure 1 and Table 1). However, diastolic hypertension was more prevalent in patients with incident stroke (55.6% vs. 14.6%; adjusted HR, 6.62; 95% CI, 1.59–27.7) (Table 1). The Kaplan–Meier curve showed that participants with diastolic hypertension had a higher risk of incident stroke (log-rank P=0.001) (Supplementary Figure 1). The SD of SBP, DBP, and PP were not associated with the incidence of stroke. Furthermore, although we included 31 patients who did not have follow-up MRI to test the effects of BP on stroke incidence, the results remained unchanged (Supplementary Table 4). However, there were no stroke events among these 31 patients because their follow-up durations were significantly shorter than those of the original patients (median [IQR], 8 [5–15] vs. 27 [22–43] months; P<0.001).
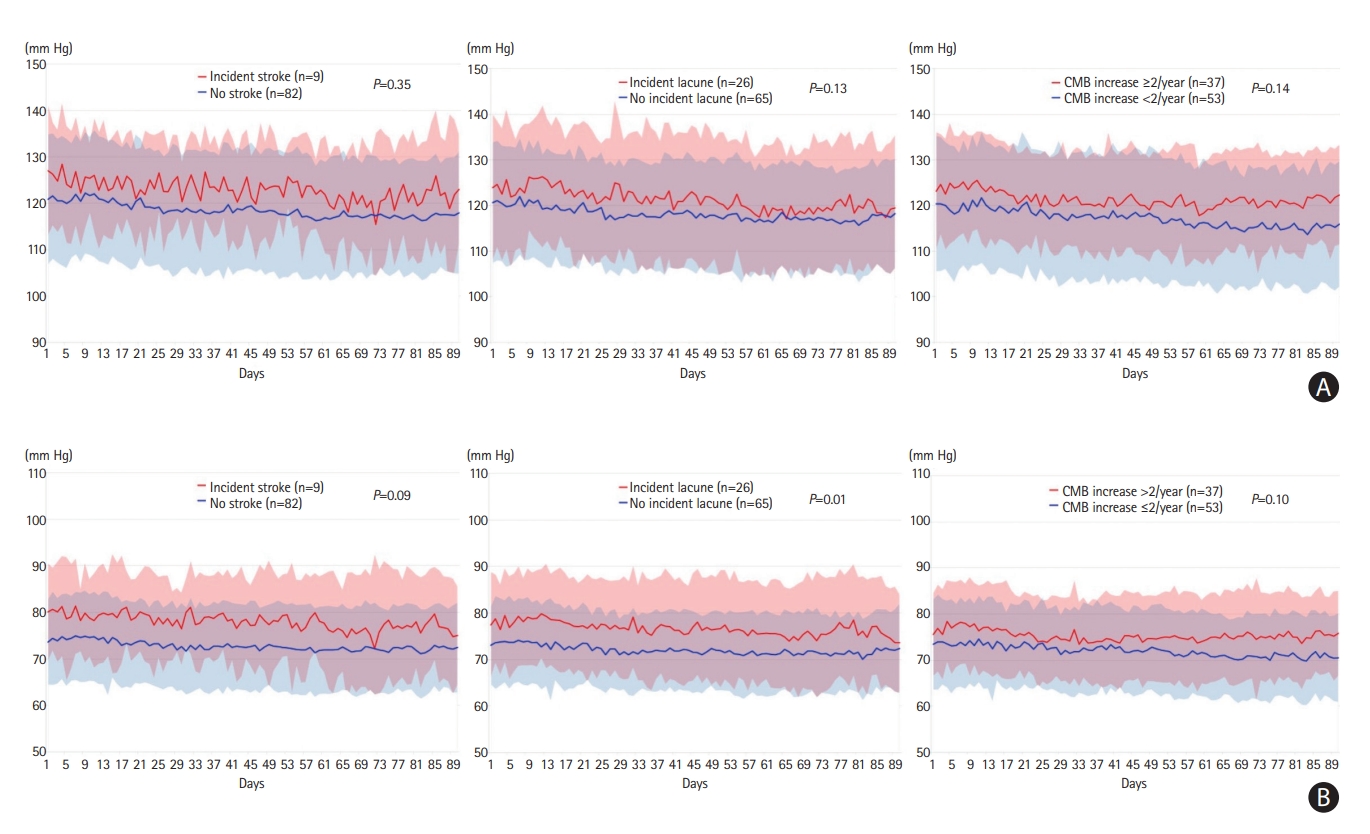
Distribution of 90-day blood pressure and outcomes. (A) The mean systolic blood pressure is not significantly different between patients with and without predefined outcomes. (B) Mean diastolic blood pressure is significantly higher in patients with incident lacune (P=0.01) and is borderline significantly higher in patients with cerebral microbleed (CMB) increase ≥2 per year (P=0.10) or incident stroke (P=0.09) compared to those without these outcomes. The shaded area indicated standard deviations of blood pressure.

Effects of blood pressure or hypertension on neuroimaging and clinical outcomes
Compared to baseline MRI, 26 (28.6%) patients had incident lacune and 37 (41.1%) had increased CMB ≥2 per year on follow-up MRI. The mean DBP was significantly higher in patients with incident lacune (77.1±9.1 vs. 72.2±6.8 mm Hg, P=0.01) (Figure 1). A higher mean DBP, larger SD of SBP, DBP, and PP, and diastolic hypertension were associated with incident lacunes (Table 1). Most of the BP parameters were not associated with increased CMB increase ≥2 per year, except diastolic hypertension (Table 1). The association between diastolic hypertension and clinical and neuroimaging outcomes remained significant after adjusting for the most common NOTCH3 R544C variant.
The scatterplots of the 90-day mean BP and the annual changes in neuroimaging markers are presented in Supplementary Figure 2. There was a positive association between mean DBP and increased WML proportion (β=0.005, P=0.02), mean DBP and increased number of lacune (relative risk [RR], 1.69; 95% CI, 1.26–2.28) and CMB (RR, 2.43; 95% CI, 1.46–4.05) (Supplementary Table 5).
The present study involved the largest sample size to date of continuous and comprehensive BP records in patients with CADASIL and yielded two main findings. First, although BP in our CADASIL participants was well controlled, since mean 90-day BP recordings largely fell within the target range (<130/80 mm Hg), mild elevations in BP, especially diastolic hypertension, were associated with an increased risk of further events, including incident stroke and progression of neuroimaging abnormalities. Second, 90-day average BP, rather than day-by-day BP variability, was significantly associated with the severity of the neuroimaging markers of CSVD in patients with CADASIL. The limitations of this study include potential BP measurement errors by participants, a relatively small sample size, and the question of generalizability beyond East Asian patients carrying the NOTCH3 R544C variant.
Previous clinical trials on the effects of BP control on CSVD have typically focused on SBP. Diastolic hypertension, caused by increased peripheral vascular resistance, may represent a group of patients whose vascular elasticity and endothelial function declined earlier than others; therefore, they were at risk of worsening small vessel disease markers and even symptomatic stroke [8,9]. In previous studies, increased DBP was shown to independently influence cardiovascular outcome, including stroke [8,9]. Furthermore, patients with hypertension aged <70 years are at greater risk of WML progression when their DBP increased [10]. Because patients with CADASIL could suffer from cerebrovascular diseases at an earlier age than the general population, more attention should be paid to controlling DBP for these patients. More research or clinical trials to address the issue of effective monitoring and management of BP, especially DBP, are crucial for patients with CADASIL.
Supplementary materials
Supplementary materials related to this article can be found online at https://doi.org/10.5853/jos.2023.02880.
Characteristics of CADASIL patients
Change in neuroimaging markers
Clinical features and outcomes between NOTCH3 R544C and non-R544C variant carriers
Effects of blood pressure or hypertension on clinical outcome when including patients who do not have follow-up MRI in the analysis
Association between blood pressure and change in neuroimaging markers in CADASIL patients
Kaplan–Meier plot for incident stroke. CADASIL patients with mean diastolic blood pressure (DBP) >80 mm Hg had a higher risk of incident stroke.
Scatter plot of mean blood pressure and annual change of neuroimaging markers. In unadjusted linear regression, significant associations existed between systolic blood pressure (BP) and changes in cortical thickness (P=0.03), incident lacune (P=0.03), and incident cerebral microbleeds (P=0.02), and diastolic BP and incident cerebral microbleeds (P=0.02). WML, white matter lesion; CTh, cortical thickness; BPF, brain parenchymal fraction; CMB, cerebral microbleeds.
Notes
Funding statement
This study was supported by grants from the Taipei Veterans General Hospital-National Taiwan University Hospital Joint Research Program (VN108-08), Ministry of Science and Technology, Taiwan (109-2628-B075-025), and Academia Sinica (AS-GC111-L04).
Conflicts of interest
The authors have no financial conflicts of interest.
Author contribution
Conceptualization: SCT, YCL (Yi-Chung Lee). Study design: CHC, SCT, YCL (Yi-Chu Liao), YCL (Yi-Chung Lee). Methodology: CHC, SCT. Data collection: all authors. Investigation: YCL (Yi-Chu Liao), SCT. Statistical analysis: CHC. Writing—original draft: CHC. Writing—review & editing: YCL (Yi-Chu Liao), YWC, CPC, YCL (Yi-Chung Lee), SCT. Funding acquisition: YCL (Yi-Chu Liao), YCL (Yi-Chung Lee), SCT. Approval of final manuscript: all authors.
Acknowledgements
We thank Ms. Yu-Fang Chang for organizing and coordinating patient enrollment in TCR.