Magnetic Resonance Imaging in Acute Ischemic Stroke Treatment
Article information
Abstract
Although intravenous administration of tissue plasminogen activator is the only proven treatment after acute ischemic stroke, there is always a concern of hemorrhagic risk after thrombolysis. Therefore, selection of patients with potential benefits in overcoming potential harms of thrombolysis is of great importance. Despite the practical issues in using magnetic resonance imaging (MRI) for acute stroke treatment, multimodal MRI can provide useful information for accurate diagnosis of stroke, evaluation of the risks and benefits of thrombolysis, and prediction of outcomes. For example, the high sensitivity and specificity of diffusion-weighted image (DWI) can help distinguish acute ischemic stroke from stroke-mimics. Additionally, the lesion mismatch between perfusion-weighted image (PWI) and DWI is thought to represent potential salvageable tissue by reperfusion therapy. However, the optimal threshold to discriminate between benign oligemic areas and the penumbra is still debatable. Signal changes of fluid-attenuated inversion recovery image within DWI lesions may be a surrogate marker for ischemic lesion age and might indicate risks of hemorrhage after thrombolysis. Clot sign on gradient echo image may reflect the nature of clot, and their location, length and morphology may provide predictive information on recanalization by reperfusion therapy. However, previous clinical trials which solely or mainly relied on perfusion-diffusion mismatch for patient selection, failed to show benefits of MRI-based thrombolysis. Therefore, understanding the clinical implication of various useful MRI findings and comprehensively incorporating those variables into therapeutic decision-making may be a more reasonable approach for expanding the indication of acute stroke thrombolysis.
Introduction
Ischemic stroke is one of the major causes of death and disability. For the last few decades, many efforts have been made to improve the outcome of acute ischemic stroke treatment. However, thrombolytic therapy is still the only proven treatment for patients following an acute ischemic stroke within 3 or 4.5 hours of symptom onset.1,2 Studies focusing on expansion of the therapeutic time window and indication for thrombolysis are ongoing, but the adverse effects stemming from reperfusion injury, including hemorrhagic transformation (HT) or massive edema are still a concern.3 Therefore, it is important to select appropriate patients based on an assessment of individual risks and benefits for thrombolysis.
Multimodal magnetic resonance imaging (MRI) is useful for diagnosing ischemic stroke and for determining treatment strategies in the acute phase.4,5 In the acute stage, early diagnosis of ischemic stroke and its differentiation from stroke-mimics are important.6,7 Various imaging findings from MRI sequences help determine stroke mechanisms, which affect prognosis, and thereby play an important role in treatment decisions. Lesion mismatch profiles on MRI help us to assess potential risks and benefits of thrombolysis by providing information on salvageable tissue or ischemic lesion age.8,9,10
Some of these parameters have been used in previous MRI-based thrombolysis trials, but the results were not satisfactory. While simply using a few parameters may be easily applicable, other valuable information for diagnosing stroke, determining the mechanism, and assessing the potential risks and benefits may be overlooked. Therefore, it is critical to understand the clinical implication of various imaging findings, and comprehensively consider them before deciding the treatment for acute stroke.
In this review, we discuss the clinical implication of various MRI findings, specifically focusing on 1) MRI for diagnosis of acute stroke and its mechanism, 2) MRI-based patient selection for reperfusion therapy, 3) MRI outcome measures, and 4) the practicality of using MRI for hyperacute stroke.
Imaging for acute stroke diagnosis
Diagnosis of acute stroke
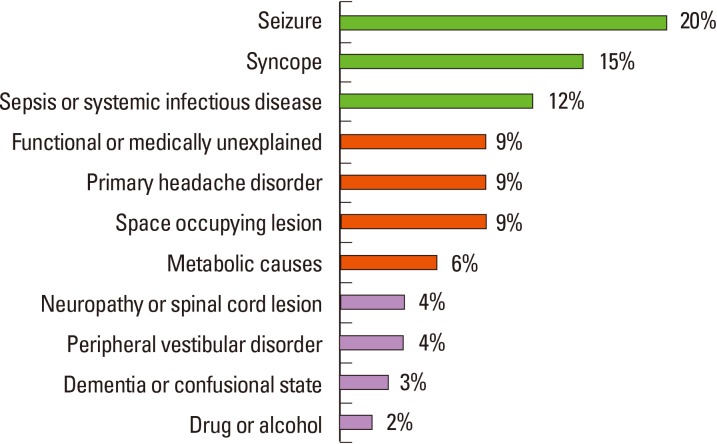
Diagnosis of stroke largely depends on clinical presentation. Stroke-mimics account for 19%-30% of suspected stroke presentations, with diverse underlying etiology (Figure 1).11 Physicians need to consider a broad differential diagnosis when evaluating a patient presenting with a focal neurological deficit. With recent advances in MRI technology, ischemic lesions can be identified with high accuracy using diffusion-weighted image (DWI; 88%-100% sensitivity and 95%-100% specificity). The lesions appear as hyperintense areas on DWI and as correlative hypointense areas on apparent diffusion coefficient (ADC) maps, even within 3 minutes of stroke onset.12 Moreover, small cortical or subcortical lesions, especially in the posterior fossa or brain stem, are more easily detected by MRI than computed tomography (CT) at the acute stage. However, the small lesions located at the brain stem that present mild symptoms, especially ataxic hemiparesis or intranuclear ophthalmoplegia, could be invisible on initial DWI.13,14 In addition, other neurological diseases (i.e., Creutzfeldt-Jakob disease or progressive multifocal leukodystrophy) may also show high-intensity lesions on DWI, mimicking ischemic stroke.15,16 Therefore, considering clinical presentation as well as performing follow-up images may be beneficial for diagnosis.
Assessing the mechanism of stroke
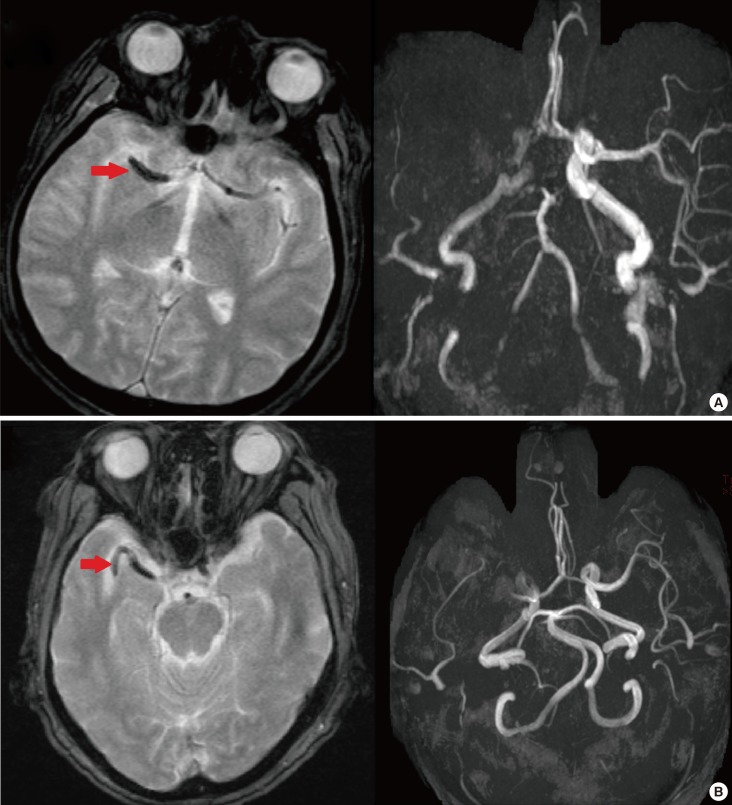
Many studies have attempted to unravel stroke pathomechanism by ischemic lesion topography on DWI. It has been reported that multiple lesions in the unilateral anterior circulation or small, scattered lesions in one vascular territory are related to large artery atherosclerosis (Figure 2A, B).17 Perforating infarcts, in addition to pial or borderzone infarcts were distinctive pattern for intracranial atherosclerosis (Figure 2A).18,19 DWI also enables the detection of small lacunar infarcts that had previously been undetectable on CT. Fluid-attenuated inversion recovery (FLAIR) image demonstrate subacute or chronic ischemic lesions, which may help in classifying the subtype of index stroke.20 For example, recurrent deep perforating infarcts may develop in patients who have high burden of small vessel pathology.
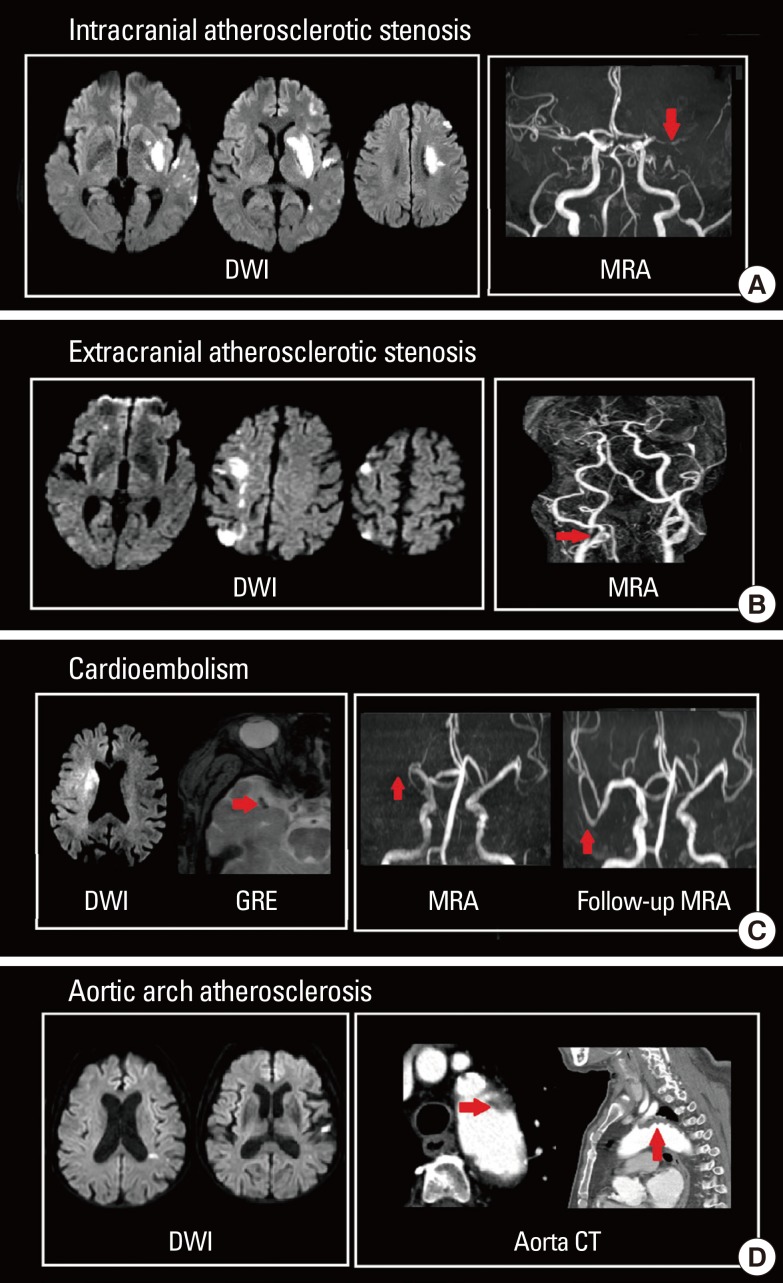
DWI lesion patterns according to stroke subtypes. (A) Intracranial atherosclerotic stenosis, (B) extracranial atherosclerotic stenosis, (C) cardioembolism, and (D) aortic arch embolism.
Cardioembolism can be suspected when patients exhibit acute multiple territorial lesions21 or a single large cortical and subcortical lesion on DWI.17,22 Particularly, early spontaneous recanalization of initially occluded vessels or abrupt occlusion without other atherosclerotic diseases on magnetic resonance angiography (MRA) may suggest cardioembolic stroke (Figure 2C).23,24 Hypointense signals with blooming artifacts in the vascular cistern on gradient echo (GRE) image (susceptible vessel sign; SVS), which may reflect the presence of deoxygenated hemoglobin of red thrombi, are usually associated with cardioembolic stroke (Figure 2C).25 Patent foramen ovale, another source of cardioembolism, usually causes small cortical lesions in vertebro-basilar circulation, which may reflect high blood flow in the posterior circulation provoked by the Valsalva maneuver.26 Currently, aortic arch atherosclerosis is accepted as a possible embolic source in cryptogenic stroke, and the resulting ischemic lesion patterns and clinical outcomes differ from those of cardiogenic embolism. Moreover, aortic arch embolism has a higher propensity of causing left hemispheric stroke and multiple small infarcts (Figure 2D).27,28
Early assessment of the etiology ischemic stroke in the acute stage using MRI is advantageous to guide specific diagnostic work-ups and proper strategy for hyperacute reperfusion therapy and secondary stroke prevention.
Patient selection for acute stroke treatment
Evaluation of salvageable tissue
Concept of penumbra
When the cerebral blood vessel is occluded, a complex series of pathophysiological events evolve in time and space.29 First, the core of the area rapidly develops an infarction (ischemic core). However, the surrounding part of the core still exhibits minimum blood flow supplied by collateral circulation, even when neuronal function has been suspended (ischemic penumbra). The neuronal function of some parts of the ischemic penumbra can recover when blood supply is restored, and goes through a dynamic change during the acute period of ischemic stroke.30 Perfusion-weighted image (PWI) can identify ischemic penumbral tissue, whereas DWI-depicted lesions represent the ischemic core. Therefore, areas with PWI-DWI mismatch (i.e., when the perfusion lesion is larger than the diffusion lesion) have been considered representative salvageable tissue that require active treatment (Figure 3A).
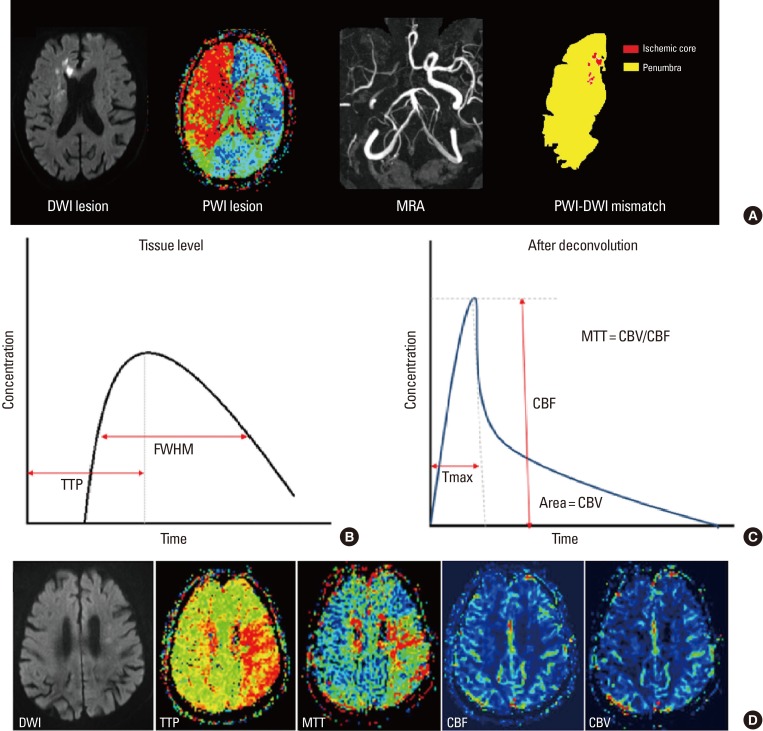
PWI-DWI mismatch (A), time-concentration curves (B and C) and various PWI parameters (D).
PWI parameters
PWI is a semi-quantitative method for evaluating brain perfusion - microcirculation in the capillary network.31 When a contrast agent is administered into a vein, it passes through cerebral vessels and alters the local magnetic field resulting in the rapid decrease of signal intensity in the surrounding brain tissue by the paramagnetic effect of the contrast. The variation of signal intensity is measured during 1 minute, serially with 1- to 2-second intervals by the echo-planar image technique. From this data, time-concentration curves can be obtained at the tissue level, voxel-by-voxel (Figure 3B). After deconvolution with arterial input functions, a deconvolved curve can be obtained (Figure 3C), and various perfusion parameters can be calculated. These parameters include cerebral blood flow (CBF), cerebral blood volume (CBV), mean transit time (MTT), time to peak (TTP), and Tmax (Figure 3D).32
CBF and CBV
CBF is a parameter usually taken at the height of deconvolved curve (Figure 3C). It reflects the blood supply to the brain tissue in a given time and is most directly related to the viability of the infarcted tissue.33 CBF is determined by cerebral perfusion pressure, the dilation of blood vessels, and blood viscosity. An area with normal CBF and delayed MTT or TTP demonstrates an area with blood flow maintained by blood vessel dilation (increased CBV), but reaching the particular area late through collaterals. CBV is measured by the whole blood quantity within the target area (area under the deconvolved curve; Figure 3C). Areas of decreased CBV correlate well with the final size of a cerebral infarction.34 This is especially the case when the area of delayed MTT with decreased CBV represents the area of brain tissue not having sufficient collateral circulation; thus, these regions will eventually evolve into cerebral infarctions.33
MTT, TTP, and Tmax
MTT is the average time required for blood flow to enter the artery and maintain the inside of the cerebral artery. MTT is calculated by CBV/CBF and is used to estimate vulnerable brain tissue which may evolve from the infarction.35 MTT shows the widest range of perfusion deficits compared to other parameters, and is therefore likely to overestimate areas with risk. If an area with MTT delay shows increased CBV, that area may have received sufficient collateral circulation or may have been currently recanalized.33
TTP describes the time it takes CBF to reach the highest value at the target tissue location (Figure 3B). TTP is an indirect measurement of brain perfusion; therefore, it provides minimum information. Since a delay in TTP can occur in a patient with chronic carotid artery stenosis without acute infarction (prolonged arrival time), TTP can also overestimate the hypo-perfused area in an acute infarction.33
Tmax is the time it takes for the tissue residue function to reach its maximum value. Tmax is a sensitive parameter reflecting changes of brain tissue into an infarction and changes in the perfusion state. Tmax has also been used as a predictor of tissue viability in many studies as a non-physiological parameter of the capability of brain tissue to survive. Since this parameter is not influenced by scan duration, Tmax has the merit that sufficient scanning for a long time is possible so that contrast agent can reach all parts.35 Thus, Tmax is the most widely accepted parameter to measure the penumbra.
PWI parameter thresholds in discriminating between penumbra and benign oligemic area
Recent studies have focused on the threshold for distinguishing a true penumbra from a benign oligemia. Although time-based perfusion variables are widely used methods assessing penumbra, there are still a lot of controversies on interpreting them.
Previously, many different thresholds for Tmax representing the true penumbra area have been suggested. For example, a Tmax >6 seconds was defined as the penumbra in the Diffusion and Perfusion Imaging Evaluation for Understanding Stroke Evolution (DEFUSE) trial,36 whereas in the effects of alteplase beyond 3 hours after stroke in the Echoplanar Imaging Thrombolytic Evaluation (EPITHET) trial cohort, a Tmax of 4 to 6 seconds delay was used.37 Another study showed that a Tmax >4 seconds delay provided the most accurate final infarct volume in patients within 3 to 6 hours after stroke onset.38 Compared with the penumbra measured from a positron emission tomography study, a Tmax ≥5.5 seconds delay matched most well.37 Recently, another study suggested that Tmax ≥10 seconds delay best predicts the final infarction.39
Taken together, these studies indicate that there is no established criterion to discriminate between benign oligemic area and the penumbra. Although a number of studies have been conducted on Tmax threshold for that purpose, there are still a lot of controversies on the optimum criterion since the threshold value to determine the final infarction varies from study by study.
PWI-DWI mismatch in patient selection
Previously, PWI-DWI mismatch was used for patient selection in several clinical trials focusing on acute stroke treatment. In the DEFUSE study, patients with PWI-DWI mismatch in the 3 to 6 hours window demonstrated more favorable clinical response after reperfusion compared to patients without a PWI-DWI mismatch.40 However, this previous study had no placebo control group and it was not designed to demonstrate the efficacy of MRI-based intravenous thrombolysis. In the EPITHET study, infarct growth was compared between patients who received tissue plasminogen activator (tPA) and those who received a placebo. The primary outcome measure was the attenuation of infarct growth using a ratio of geometric means.41 However, their results failed to demonstrate beneficial outcomes of using PWI-DWI mismatch in thrombolysis. The Desmoteplase in Acute Ischemic Stroke (DIAS) clinical trial was a phase-II trial that employed a pre-randomization penumbral imaging screening as an indication for patient selection.42 Within 3-9 hours of symptom onset, patients with ischemic stroke and at least 20% PWI-DWI mismatch (as evaluated by visual inspection) were included in the trials. However, the results of the DIAS study have failed to prove the benefit of desmoteplase versus placebo in patients with MRI-identified penumbras.
The previous trials of imaging-based thrombolysis were solely or mostly based on PWI-DWI mismatch and failed to prove any advantages. These failures however, have reinforced the benefit of salvaging the penumbral tissue by thrombolysis, and the fact that HT risk should be considered when deciding to treat a patient via thrombolysis.
Hemorrhagic risk stratification after thrombolysis
Mechanisms and clinical implication
HT is a frequent, often asymptomatic event that occurs after acute ischemic stroke. It is thought to negatively influence the early clinical course and outcome of patients, particularly those receiving thrombolytic therapy.43 HT is presumed to occur in the infarcted brain area due to the extravasation of blood components.44 Disruption of the blood-brain barrier has been proposed to precede HT.45,46 In addition, the dose-dependent side effects of tPA treatment have been discussed as risk factors for HT.47 Early blood-brain barrier disruption is associated with HT even in patients who do not receive tPA treatment for stroke.48 This might be due to an increase in vascular permeability in ischemic tissue, resulting in a leakage from small vessels when exposed to restored blood flow.
Definition and classification of HT
In the European Cooperative Acute Stroke Study (ECASS) trials,2 the types of HT after acute ischemic stroke were classified into hemorrhagic infarctions (types 1 and 2) and parenchymal hemorrhages (types 1 and 2) on the basis of CT scan characteristics (Figure 4). In the NINDS tPA Stroke Trial,1 the definition of HT required blood to be detected by CT after treatment. Irrespective of other features, detection of any blood by CT in a patient with neurological deterioration qualified the patient for symptomatic HT. In the ECASS-II trial, investigators looked for an increase of more than 4 points on the National Institutes of Health Stroke Scale (NIHSS) score and detection of blood at any site by CT for this qualification.49 Finally, in ECASS-III, an increase of more than 4 points on the NIHSS score had to be "correlated" with blood detection by CT to suggest HT as the probable cause of neurological deterioration.2
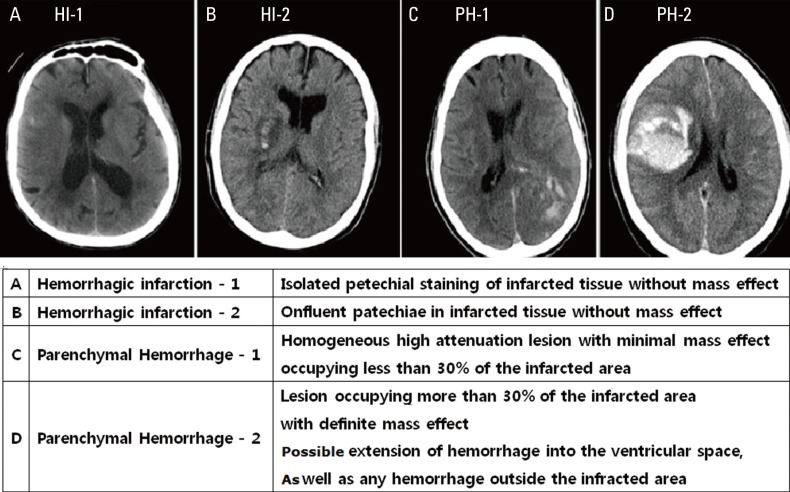
Types of hemorrhagic transformation according to ECASS criteria.
Factors associated with HT
Several factors are known to be associated with HT, and the combination of clinical and imaging data helps identify patients at high risk of symptomatic HT.50 Clinical factors such as a high initial NIHSS,51 delayed treatment time,52 and high blood pressure53 are well known to increase the incidence of HT and have been used as exclusion criteria for thrombolytic therapy. The imaging data indicative of a large infarct54 and early ischemic signs on CT are also widely used as exclusion criteria for thrombolytic therapy.55 In fact, early ischemic changes were defined in the NINDS tPA trial as the presence of one or more of the following characteristics: 1) loss of grey-white matter distinction, 2) hypodensity (hypo-attenuation) of brain parenchyma, and 3) compression of CSF spaces. However, the sensitivity and reproducibility of early ischemic signs on brain CT is poor.56
MRI predictors for HT
A low ADC value on baseline MRIs has been suggested as an independent predictor of HT after thrombolysis.54 Results of other studies have shown that large DWI lesion volume, or very low/absent apparent CBV or CBF can increase the risk of HT.57 Focal FLAIR hyperintensity within acute infarcts is also associated with an increased risk of symptomatic HT in several studies.58 The predictive value of silent microbleeds for HT after thrombolysis is unclear. Although their presence on GRE has been suggested to be predictive of increased HT risk after treatment with tPA,59 data from a large cohort study indicated that micro-hemorrhages were not an independent risk factor for early and symptomatic HT, irrespective of the number of microbleeds.60 In addition, a larger PWI lesion volume (a measure of ischemic duration) was associated with hemorrhagic infarction, but not with parenchymal hemorrhage.61
Considering the pathomechanism of HT, radiological markers that directly indicate blood-brain barrier permeability could predict HT after acute ischemic stroke. In fact, it has been shown that contrast-enhancement can predict tPA-induced hemorrhages in rat models.62 These techniques have been assessed in humans, including delayed gadolinium enhancement of the CSF space (Figure 5A)48,63,64,65 or sulcal enlargement on FLAIR images,66 parenchymal enhancement on post-contrast T1-weighted images (Figure 5B),67 and permeability images derived from pretreatment perfusion MRIs.68

MRI markers predicting hemorrhagic transformation (A) Delayed gadolinium enhancement of the CSF space (arrows); (B) Parenchymal enhancement at post contrast T1-weighted image (arrow) and hemorrhagic transformation at the corresponding area at follow-up (arrow).
Assessing the nature and burden of clots
Magnetic susceptibility artifacts distort ferromagnetic objects. Technically, shortening the echo-time, increasing the frequency matrix, and decreasing the slice thickness could reduce artifact size. On the other hand, magnetic susceptibility artifacts may also enhance the detection of red thrombi clots, which are ferromagnetic. As the composition, size, and site of clot occluding cerebral arteries are important factors for selecting the treatment strategy, GRE and SVS may be useful for treatment decisions. Initial, long-standing, platelet-rich, and well-organized white thrombi in the cerebral artery under high shear-stress are more resistant to thrombolytic therapy than fresh, fibrin-rich red thrombi formed under static conditions. Therefore, SVS is known as a marker with higher possibility of recanalization.69 Second, the location of a clot is also important. SVS of M1 is a strong predictor of recanalization failure after tPA.70 Therefore, intra-arterial thrombolysis may be more effective than tPA in certain cases. Third, the clot length is typically used to quantify the thrombotic burden.71 This is important since intra-venous tPA has nearly no potential to recanalize an MCA occlusion with a clot length exceeding 8 mm (Figure 6A).72 Finally, irregular and tortuous clot morphologies can decrease the technical and clinical success of thrombectomies in M1 occlusions (Figure 6B).73
Clot presented on gradient echo image (arrow) with long segment (A) and tortuous vessel (B).
MRI-based thrombolysis in unclear-onset patients
Physicians are frequently confronted with patients in whom the exact time of stroke symptom onset is not known,74 and attempts have been made to use signal changes in FLAIR images as a kind of "tissue clock".75 For example, it is known that signal intensity in FLAIR images proportionately increases with a rise in water content inside the infarcted tissue. The water content rises due to vasogenic edema as the blood-brain barrier is disrupted, and occurs within 1 to 4 hours of stroke onset.76 Therefore, DWI-FLAIR mismatch (i.e., lesion visible on DWI but not on FLAIR) has been used as a surrogate marker for estimating the lesion age of unknown stroke onset, and can help determine the use of thrombolytic agent (Figure 7).77,78 Patients with DWI-FLAIR mismatch are likely to be within the time window for thrombolysis, the specificity and predictive value of which have both been shown to be high (93% and 94%, respectively).77 Finally, in the reperfusion therapy in unclear-onset stroke based on MRI evaluation (RESTORE), patients with unclear stroke onset, within 6 hours of symptom detection with PWI-DWI mismatch >20% and negative or subtle FLAIR change, were treated with tPA or endovascular therapy, and MRI-based reperfusion therapy was found to be feasible and safe.79
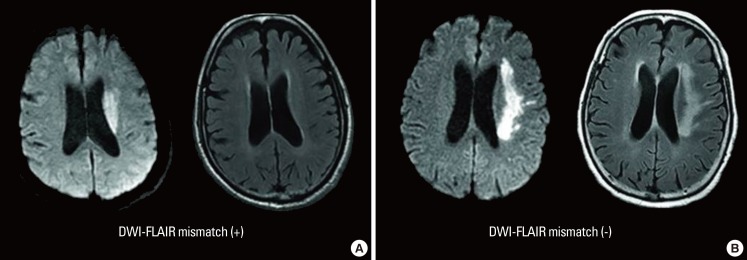
DWI-FLAIR mismatch: positive (A) and negative (B).
However, potential confounding factors that interfere with the diagnostic accuracy of DWI-FLAIR mismatch also exist. In addition to the time from symptom onset, younger age and large ischemic lesion volume have been reported to be associated with high FLAIR signal intensity.9 As age and lesion size alter permeability in the blood-brain barrier, these biological variations may cause altered FLAIR signal intensity.80 In addition, there is an issue stemming from the low inter-rater reliability of DWI-FLAIR mismatch. For example, in a previous study it was reported that the inter-rater reliability of FLAIR change was only moderate, based on visual rating.9 In other studies, the mean signal intensity of a circular region-of-interest inside the infarcted tissue was quantitatively measured and used to overcome this issue, but even this approach failed to improve inter-rater reliability.81 On the other hand, color-coding of FLAIR signal change has been reported to enhance visual distinguishability, and seems to be effective in decreasing the disagreement between raters.82 Further results of the on-going trials may provide more knowledge on the risk and benefit of MRI-based thrombolysis in this particular group of patients. Table 1 introduces these major on-going clinical trials.

On-going clinical trial to expand the time-window of intra-venous thrombolysis
MRI-based thrombolysis in patients with minor stroke
One-third of acute ischemic strokes that have occurred within the therapeutic time window have been excluded because of mild or rapidly improving symptoms.83 However, poor outcome in patients who did not receive tPA because of minor stroke symptoms has been reported with up to 30% of these patients at risk of death and dependence.84 Moreover, a subgroup of patients with minor stroke and proximal vessel occlusion were found to be at higher risk of neurological deterioration.84 Clinical criteria, such as NIHSS scores, are poorly predictive of proximal intracranial occlusion, and underestimate the risk of subsequent neurological deterioration.85 Thus, off-label thrombolytic therapy was not associated with higher complication rates in cases of minor stroke.86
MRI has been suggested as a tool to identify patients with minor stroke who may benefit from thrombolysis. In patients that have experienced a minor stroke, a significant mismatch can persist for days and their symptoms may aggravate without recanalization therapy. Recent studies have reported that treatment with tPA based on PWI-DWI mismatch is safe and effective in patients with minor stroke.87 However, the lesion pattern, rather than the PWI-DWI mismatch, has been shown to be an important predictor of neurological decline in patients that have undergone a minor stroke.88 Still, no systematic data are available on the effect of IV-tPA in cases of minor stroke. Thus, only the inclusion of patients with minor stroke in future randomized controlled trials of intravenous thrombolysis will allow us to answer the question of whether thrombolysis is effective and safe in this group of patients.
MRI outcome measures
Clinical trials evaluating the success of thrombolysis have relied on various outcome parameters to measure how well an ischemic vascular bed responds to treatment. Usually, clinical parameters based on the severity of neurological deficits (NIHSS scores) or functional disability (modified Rankin Scale or Barthel Index) are used. However, as these clinical parameters are influenced by various confounders, including the lesion location or patient age, they do not directly demonstrate the treatment effect of salvaging the penumbral tissue. On the other hand, imaging parameters have an advantage in quantitatively measuring the effect of treatment by demonstrating the initial infarction core, penumbra, and the final infarction volume.89 The three main categories used in outcome measures by MRI are, 1) DWI lesion volume change, 2) PWI lesion volume change, and 3) recanalization of the occluded vessel on MRA.
Currently, there is no consensus on how to determine infarct growth. This measure has been based on the change in lesion volume between baseline and follow-up MRIs (DWI at 24 hours and FLAIR at 5 days).90 In the EPITHET study, various measures of infarction volume were suggested, such as geometric mean and the difference in cube-root volumes.41 However, measurement tools in the clinical setting should be easy to use, and PWI parameters used in the previous clinical trials differ from study to study. Thus, there are some difficulties in comparing the results of each study. For example, in the DEFUSE study, early reperfusion was defined as a more than 50% reduction in the volume of the PWI lesion (Tmax >6 seconds).91 On the other hand, reperfusion in the EPITHET study was defined as >90% reduction between baseline and day-3 PWI lesion volumes.41 This discrepancy is also seen in the DIAS study as these investigators defined reperfusion as ≥30% reduction of MTT volume abnormality between baseline and follow-up images.42
Two distinct measures for assessing recanalization have been used to evaluate the effectiveness of thrombolytic therapy. First, recanalization of the primary arterial occlusive lesion has been evaluated using the Arterial Occlusive Lesion (AOL) grading system. Second, reperfusion of the distal vascular bed has been evaluated using the Thrombolysis in Myocardial Infarction (TIMI) and the Thrombolysis in Cerebral Infarction (TICI) grading system (Table 2). However, the use of multiple scales has resulted in some confusion and limits the comparison among studies.
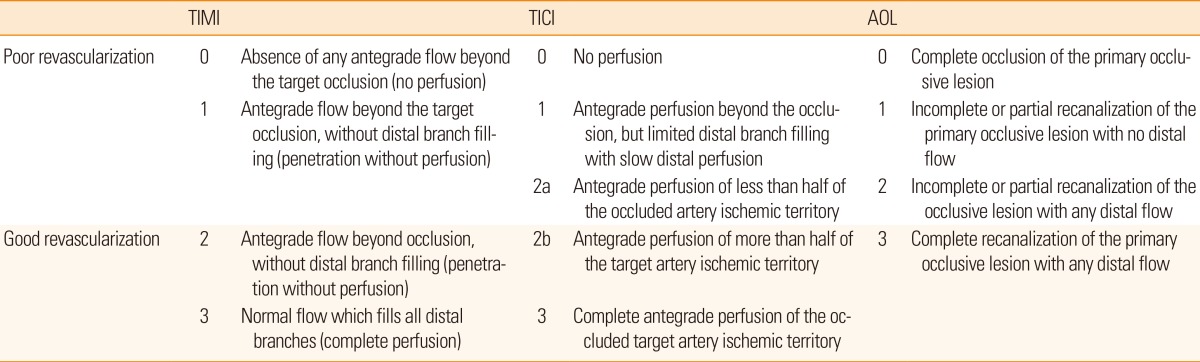
Recanalization grading system
In the Interventional Management of Stroke (IMS)-1 trial,92 the AOL grading system was used. However, recanalization of the primary arterial occlusive lesion does not guarantee complete reperfusion of the downstream arterioles. The TIMI definition, which has been used to describe flow in the coronary arteries, was adapted to evaluate the degree of reperfusion.93,94 Therefore, in order to emphasize the use of a standard grading system specific to intracranial circulation, a TICI grading system has been suggested.95 Recently, the TICI grading system is regarded as the most reliable parameter for recanalization. While there are some limitations of angiography based scales, combining the scales with MR perfusion may be a good parameter for treatment outcome.
Correlation of MRI parameters and clinical outcome
It is important to ask whether MRI parameters are correlated with clinical outcomes. In fact, it has been shown that early infarct growth within the first week can predict long-term clinical outcome after thrombolysis.96 Specifically, when recanalization scores were dichotomized into poor (AOL 0-2, TIMI 0-1, and TICI 0-2a) versus good revascularization (AOL 3, TIMI 2-3, TICI 2b-3), investigators found a significant difference between the two groups (Table 2). Moreover, it was revealed that patients with good clinical outcomes (modified Rankin scale 0-2) had smaller infarct growth, smaller perfusion growth, and good revascularization.97
Practicality of MRI for use in hyperacute stroke
Multimodal MRI reveals various useful parameters for deciding treatment routes of acute stroke (Table 3). This technology is especially useful when stroke diagnosis is uncertain (stroke-mimics), stroke onset is unclear (wake-up or unwitnessed daytime strokes), or clinic-imaging mismatches exist. However, in spite of the potential benefits of MRI, practical issues exist limiting the use of MRI in the acute stage of ischemic stroke.98 One of the major issues is the long scan time when compared to CT. In general, although MRI-based decisions of thrombolysis have prolonged the door-to-needle time, the clinical outcome has been more favorable.99,100 Therefore, the use of MRI in acute stroke treatment is clinically practical and feasible.101,102 On the other hand, considering that "time is brain" in the hyperacute stage of ischemic stroke, minimizing the evaluation time taken for the decision of treatment may expand the benefit of thrombolysis. Interestingly, a recent study revealed a feasible diagnostic quality of 6-minute multimodal MRI using echo-planar FLAIR and GRE in patients with acute ischemic stroke, and this may enhance the usage of MRI in acute stroke treatment.103 The effect and usefulness of this paradigm in acute stroke treatment should be verified by future trials. In addition, various new MRI advancements are actively under research, such as arterial spin labeling, techniques to measure collateral flows, computational flow dynamics, and high-resolution vessel-wall MRI. These novel imaging biomarkers may be helpful in determining the treatment strategy for acute ischemic stroke.
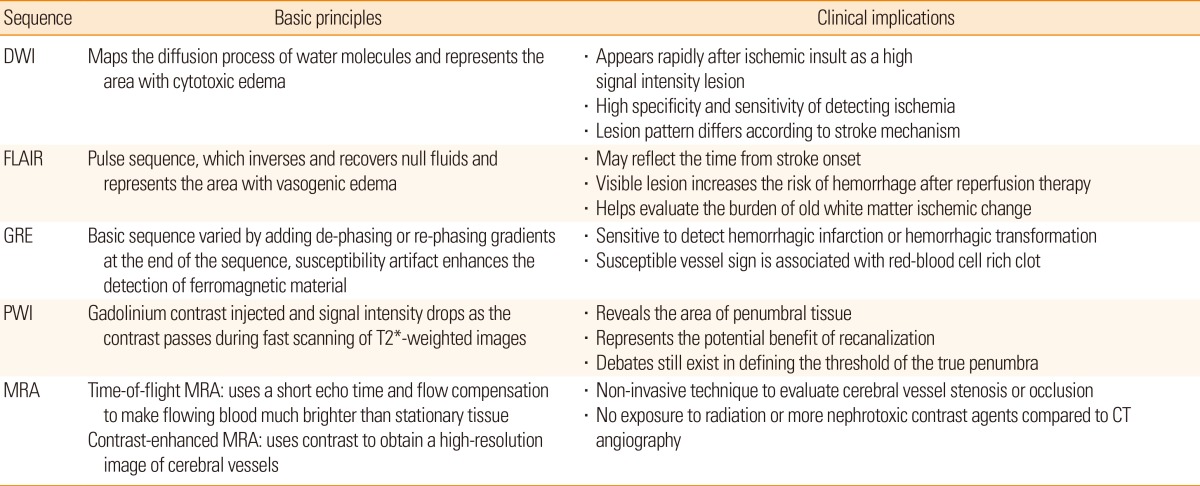
Basic principles and clinical implications of multimodal MRI
Conclusion
Multimodal imaging provides information that is useful for diagnosing ischemic stroke, selecting appropriate patients for thrombolytic therapy, and predicting the prognosis of ischemic stroke. Only depending on a single or a few parameters may not be sufficient, instead comprehensively combining the information from each MRI sequence (i.e., DWI, FLAIR, GRE, and PWI) and using various mismatch parameters (DWI-FLAIR mismatch and/or PWI-DWI mismatch) may be more helpful in establishing an indication of MRI-based thrombolysis.
Notes
This study was supported by grants from the Korea Health Technology R&D Project, Ministry for Health & Welfare, Republic of Korea (HI12C1847 and HI11C1531).
The authors have no financial conflicts of interest.