Blood Pressure May Be Associated with Arterial Collateralization in Anterior Circulation Ischemic Stroke before Acute Reperfusion Therapy
Article information
Abstract
Background and Purpose
Leptomeningeal collaterals maintain arterial perfusion in acute arterial occlusion but may fluctuate subject to arterial blood pressure (ABP). We aim to investigate the relationship between ABP and collaterals as assessed by computer tomography (CT) perfusion in acute ischemic stroke.
Methods
We retrospectively analyzed acute anterior circulation ischemic stroke patients with CT perfusion from 2009 to 2014. Collateral status using relative filling time delay (rFTD) determined by time delay of collateral-derived contrast opacification within the Sylvian fissure, from 0 seconds to unlimited count. The data were analyzed by zero-inflated negative binomial regression model including an appropriate interaction examining in the model in terms of occlusion location and onset-to-CT time (OCT).
Results
Two hundred and seventy patients were included. We found that increment of 10 mm Hg in BP, the odds that a patient would have rFTD equal to 0 seconds increased by 27.9% in systolic BP (SBP) (p=0.001), by 73.9% in diastolic BP (DBP) (p<0.001) and by 68.5% in mean BP (MBP) (p<0.001). For patients with rFTD not necessarily equal to 0 seconds, every 10 mm Hg increase in BP, there was a 7% decrease in expected count of seconds for rFTD in SBP (p=0.002), 10% decrease for rFTD in DBP and 11% decrease for rFTD in MBP. The arterial occlusion location and OCT showed no significant interaction in the BP-rFTD relationship (p>0.05).
Conclusions
In acute ischemic stroke, higher ABP is possibly associated with improved leptomeningeal collaterals as identified by decreased rFTD.
Introduction
Leptomeningeal collaterals provide an important pathway in the maintenance of blood flow to brain regions distal to an arterial occlusion [1-5], critically influencing clinical outcomes [6-8], especially during the ultra-early ischemic phase before recanalization treatment [9]. In addition, autoregulation of collaterals varies, leading to dependence of at-risk tissue on systolic mean arterial pressure [10]. The corollary is that increase in arterial blood pressure may improve arterial perfusion in acute ischemic stroke, leading to minimization of final infarct volume in animal model [11]. Furthermore, raised arterial blood pressure may reduce hypoperfusion in acute ischemic stroke [12,13]. Of note, a U-shaped relationship between blood pressure on hospital admission during the acute phase of ischemic stroke and mortality has been described [14-16], suggesting that undue hypotension leads to worse outcome, likely explained by underperfusion. However, the positive influence of higher mean arterial pressure on leptomeningeal collateral flow remains unsubstantiated.
In this study, we aim to investigate the impact of blood pressure on arterial collaterals. According to our previous research findings, relative filling time delay (rFTD) [17], a surrogate marker for collaterals, utilizing computer tomography perfusion source imaging (CTP-SI) to assess leptomeningeal collaterals indirectly (time delay [in seconds] of collateral-derived contrast opacification within the Sylvian fissure), has suggested a significant association with the size of infarct volume and clinical outcomes. We hypothesize that in hyperacute and pre-reperfusion-treatment ischemic stroke patients, increase in arterial blood pressure is associated with decrease in rFTD, indicating improved leptomeningeal collaterals.
Methods
Study design and patient cohort
This was a single-center retrospective cohort study involving patients with acute anterior circulation ischemic stroke who received intravenous altepase within 4.5 hours after stroke and/or intra-arterial therapy within 6 hours at the Royal Melbourne Hospital during the period from January 2009 to December 2014. This study was approved by Melbourne Health Human Research Ethics Committee.
Patients were eligible for inclusion if they underwent computer tomography (CT) perfusion before any recanalization treatment and had confirmed records of systemic blood pressure before imaging. While those who had stroke-like symptoms without any reliable evidences on neuroimaging (including non-contrast CT, CT perfusion and magnetic resonance imaging diffusion) to support the diagnosis were excluded.
Clinical information
Clinical parameters, identified through computerized databases, were collected. The following baseline parameters were colected: (1) demographics (age, gender); (2) vascular risk factors including: hypertension, diabetes mellitus, history of smoking, hyperlipidemia, ischemic heart disease, atrial fibrillation, previous stroke and transient ischemic attack (TIA); (3) stroke severity assessed by National Institutes of Health Stroke Scale (NIHSS). Systemic blood pressure acquired before CT perfusion, including systolic blood pressure (SBP), diastolic blood pressure (DBP) and mean blood pressure (MBP) which was calculated by the following formula MBP=[SBP+2×DBP]/3. The time of onset to CT perfusion performing was identified as the period between the time point of symptoms onset or when the patient was last seen neurologically well and the time of CT perfusion by the minute.
Imaging parameters
CT perfusion data were obtained from pictures archiving and communication system in Royal Melbourne Hospital on a range of hardware platforms using protocols based on current consensus recommendations [18,19]. Before 2013, images were acquired by 16-section Somatom CT (Siemens, Erlangen, Germany; two separate CT perfusion slabs with 24-mm thick). During 2013 till the end of 2014, Flash 128 Slice CT was available routinely (Siemens, Definition, Germany; two separate CT perfusion slabs with 10-mm thick). Iodinated contrast (40-mL iohexol 350 mgI/mL, Omnipaque 350; GE Healthcare, Milwaukee, WI, USA) was injected at 8 mL/s, and 40 images were acquired per second (total acquisition time, 44 seconds).
Imaging analysis
CT perfusion images for each patient were reviewed by two neurologists and one research fellow trained in neuroimaing (B.J., B.Y., L.K.) with consensus opinion reached on collateral supply. The status of the leptomeningeal collaterals was evaluated using rFTD identified by unprocessed CTP-SI DICOM images between the normal middle cerebral artery Sylvian branches and those in the affected hemisphere. It was defined as the time difference (in seconds) between the first appearances of contrast in each Sylvian fissure (Figure 1). All reviewers were blinded to clinical outcome during the agreement assessment, and measured by inter-reviewer Kappa in statistical analysis.
This picture showed a typical case of relative filling time delay (rFTD): a 71-year-old male patient presenting with left hemiplegia and dysphasia arrived hospital and underwent computer tomography examination 81 minutes after onset. Computer tomography angiography indicated the occluded right internal carotid artery and M1 segment of the right middle cerebral artery. Computer tomography perfusion source imaging (CTP-SI) illustrated that contrast signal (red arrow) firstly appeared in the normal side’s Sylvian fissure in 7:43:46 PM (A), whereas showed up in the occlusion side’s Sylvain fissure in 7:43:56 PM (B), therefore, the time gap of 10 s between bilateral contrast appearances in Sylvian fissure was identified as an rFTD.
Statistical analysis
Statistical analysis was performed using STATA, version 13.1 (StataCorp, College Station, TX, USA). p<0.05 was considered to indicate statistical significance. We compared the differences of characteristics at baseline between included and excluded cohorts using the Fisher exact test for categorical variables and the Wilcoxon-Mann-Whitney test for continuous variables.
Association between rFTD (in seconds) and BP (involving SBP, DBP, and MBP) was estimated using a zero-inflated negative binomial regression model (ZINB) [20]. ZINB model is appropriate in situations where zero outcomes are overrepresented (in this study it means 0 seconds rFTD). Such model assumes that there exist two latent groups: an “always zero” group that has the count outcome of 0 seconds rFTD with certainty, and a “not always zero” group that may have a 0-second or a more-than- 0-second in rFTD. The model estimates two sets of coefficients: the coefficients estimating change in the odds of belonging to “always zero” group compared to “not always zero” group by 10 mm Hg of blood pressure (holding all other variables constant), and, for “not always zero” group, the coefficients describing an expected change in the count of rFTD seconds by 10 mm Hg of blood pressure (holding all other variables constant). Specific regression models were chosen on the combination of standard fit criteria and tests as implemented in SPost suit of command in STATA [21].
The interaction of different arterial occlusion locations (e.g. middle cerebral artery [MCA] segment 1 or 2, internal carotid artery [ICA], etc.) and OCT in rFTD-BP association were examined by including appropriate interaction terms in the model.
Results
Between January 2009 and December 2014, 451 patients with definite diagnosis of acute anterior circulation ischemic stroke presented to our institution within 4.5 hours of stroke-symptom onset for intravenous tissue plasminogen activator and/or within 6 hours for retrieval therapy. The following patients were excluded: 1 patient lacked clinical information (e.g. involving medical history, imaging resources, onset blood pressure), 142 patients lacked imaging resources, 38 patients lacked blood pressure records (Figure 2).
Flow chart showing selection of eligible patients. tPA, tissue plasminogen activator.
Baseline characteristics
Two hundred and seventy patients were included into this study with completed CTP imaging and available blood pressure records. When compared with the excluded cohort, there were no significant differences in baseline characters between these two groups except NIHSS with a significant higher median score in included patients. The median age of patients was 74 yrs (q25-75: 64-80), with 44.81% (121/270) being women. Regarding vascular risk factors, hypertension was found in 65.93% (178/270); diabetes mellitus, in 26.67% (72/270); hyperlipidemia, in 40.69% (106/270); previous ischemic heart disease, in 18.89% (51/270), atrial fibrillation, in 37.04% (100/270); former and current smoker combined, in 25.93% (70/270); previous stroke or TIA history, in 12.59% (34/270) and 6.3% (17/270); and median NIHSS was 16 (q25-75: 10-20) (Table 1).
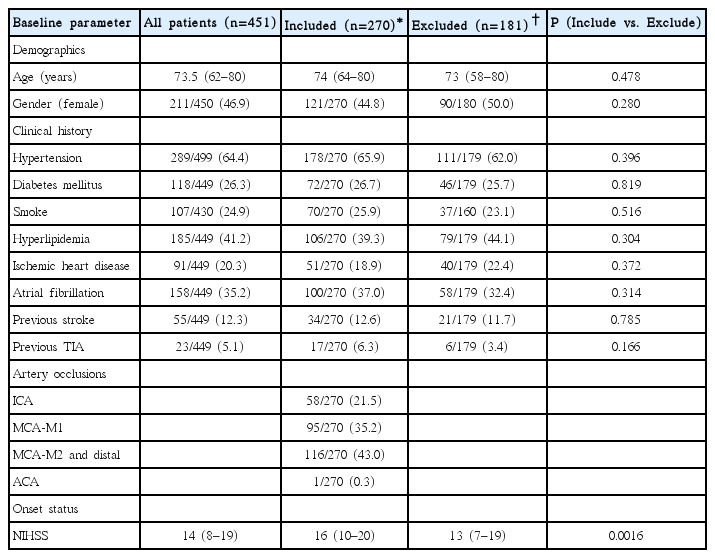
Baseline characteristics for all patients and categorized by include and exclude criterion
Relationship between arterial BP and rFTD
The variables of blood pressure and collateral circulation were analyzed. Overall, the MBP of included cohort ranged from 63.3 mm Hg to 144.7 mm Hg, with a mean of 102.4 mm Hg, and the mean SBP was 148.5 mm Hg (min=90.0, max=227.0) as well as DBP with mean level 79.4 mm Hg (min=38.0, max=121.0). rFTD of this group was from 0 second up to a maximum of 17 seconds, medium time was 3 seconds (q25-75: 0-5 s) with a large proportion of 0 second (68/270, 25.2%). The median OCT of these patients was 96.5mins (q25-75: 71-136 mins). The inter-observer consensus Kappa value is 0.74.
The relationship between rFTD and ABP was analyzed. The scatter-plot showed that the ABP, including SBP, DBP and MBP, was negatively associated with rFTD (Figure 3). The logistic regression part of the zero-inflated negative binomial regression model which investigated the association between whether or not rFTD was 0 second and BP showed that every increase of 10 mm Hg in SBP, the odds that a patient would have rFTD equal to zero would increase by 27.9% (odds ratio [OR]=1.279, 95% confidence interval [CI]: 1.106-1.479, p=0.001). The similar relationships were for DBP (OR=1.739, 95% CI: 1.302- 2.322, p<0.001) and MBP (OR=1.685, 95% CI: 1.309-2.170, p<0.001) (Table 2). In other words, higher levels of BP are associated with the higher odds of 0 second rFTD. At the same time, for the patients with rFTD not necessarily equal to zero, we showed that for every 10 mm Hg increase in SBP, there was a 7% decrease in expected count of seconds for rFTD (incidence rate ratio [IRR]=0.93, 95% CI: 0.89-0.98, p=0.002). The similar relationships were also found in DBP (IRR=0.90, 95% CI: 0.83-0.97, p=0.006) and MBP (IRR=0.89, 95% CI: 0.83- 0.95, p=0.001) (Table 2). This means that higher levels of BP are associated with shorter rFTD.

Scatter-plot for the correlation between rFTD and SBP, DBP, and MBP. rFTD, relative filling time delay; SBP, systolic blood pressure; DBP, diastolic blood pressure; MBP, mean blood pressure.
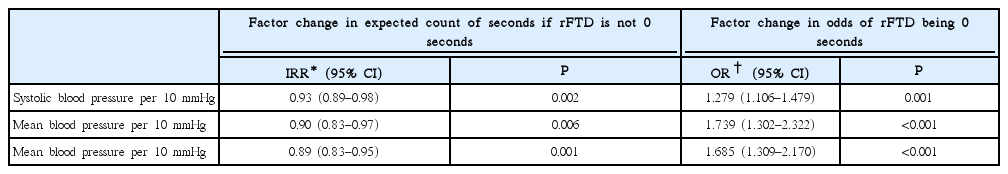
Zero-inflated negative binomial regression analyses: blood pressure is associated with rFTD
Additionally, we undertook a test of interaction of the influence of different arterial occlusion location (e.g. MCA segment 1 or 2, ICA, etc.) and OCT in the association between BP and rFTD. We found that there was no significant interaction identified in the BP-rFTD association (p>0.05).
Discussion
We showed a significant correlation between rFTD and systemic blood pressure. By ZINB regression analysis, we found that, for every 10 mm Hg increase in systolic blood pressure, rFTD decreased by 7%, suggesting improved collateral status.
Previous studies demonstrated inconclusive findings concerning the relationship between arterial blood pressure and collateral circulation [7,8,22]. Lima et al. [7], Calleja et al. [6], and Liebeskind et al. [8] did not show significant association between blood pressure, collateral circulation and clinical outcome. Rusanen et al. [22] found favorable collateral circulation was associated with moderately elevated SBP, especially in the 170-190 mm Hg range, but not reaching statistical significance. On the other hand, induce hypertension therapy has been mentioned with potential benefit on cerebral perfusion [23] and antihypertension treatment possibly linked to higher mortality [24]. In our study, we showed positive relationship between SBP and collaterals and likewise, MBP and DBP were also significantly associated with collaterals. Although we did not have enough extreme high SBP cases to conduct further subgroup analysis, the positive relationship between SBP and collaterals (represented by decreased rFTD) remain in over 170 mm Hg range in this study (Figure 3). In other words, we did not find a “ceiling effect” imposed by the blood pressure on collateral status. The potential explanations behind these differences involve different baseline characteristics and collateral scales. Comparing with Rusanen et al.’s [22] research which included 104 patients, we had an over doubled sample size with a higher average age (74 yr vs. 68.7 yr), larger proportion of diabetes (26.7% vs. 16%) and higher NIHSS (16 vs. 14) on baseline. On the other hand, unlike our study, Rusanen et al.’s result based on Souza’s25 collateral grading scale relying on CTA was limited by the shortage of the imaging technology.
Another unique feature in our study is the grading assessment to measure collaterals. A resent systemic review [26] compares conventional digital subtraction angiography (DSA), CT, magnetic resonance [27-29] and transcranial Doppler [30] and found the latter two techniques are rarely used. digital subtraction angiography as a frequently used grading scale built on the anatomic extent of retrograde flow remains the method to measure collateral extent and number [1,31,32], however, with risks of complications (e.g. puncture site hematoma, thromboembolic events etc.) [33]. CT angiography utilizing Thrombolysis In Cerebral Infarction with minor modifications obtains good inter-observer reliability [34,35] and correlation with clinical outcome [2,7,36], however, the result it provided is static (rather than dynamic) with the arterial morphology as a “snapshot” in time instead of dynamic information. In contrast, rFTD method based on CTP-SI in our study can provide a dynamic estimation of leptomeningeal collaterals without the disadvantages of digital subtraction angiography with its inherent invasiveness.
There are several limitations in our study. First, this is a retrospective study in a selected population of ischemic stroke patients with pretreatment images and blood pressure records, therefore we have excluded a group of patients due to lack of completed data and cannot perform further comparative study in dynamic blood pressure and reliable collateral circulation changing. Second, the assessment of rFTD is limited to arteries in the Sylvian fissure. On this basis, alternative collateral flow in posterior circulation cannot be assessed and will require other grading methods to visualize the regions such as occipital lobe and cerebellum. Finally, there is a potential increase in Type II error for interaction analysis due to the possible lack of power.
Conclusions
In conclusion, we showed that in hyperacute phase of ischemic stroke, higher arterial blood pressure is associated with improved leptomeningeal collaterals as exemplified by decrease rFTD. Further studies are needed to confirm the association between ABP and leptomeningeal collaterals and to clarify the effects of hypertensive treatment on clinical outcome.
Notes
The authors have no financial conflicts of interest.