

Introduction
Cerebral perfusion refers to the capillary or tissue level of blood flow. Under physical condition, the human brain has a high demand for energy to maintain its function. Although accounting for only 2% of whole body weight, the brain consumes about 20% of the total oxygen supply at rest.1 To match this high metabolic rate, a large proportion of cardiac output perfuse the brain.
The cerebral perfusion is detectable by modern imaging technology with various hemodynamic parameters.2 These parameters include cerebral blood volume (CBV), cerebral blood flow (CBF), mean transit time (MTT), time to peak (TTP). CBV is defined as the total volume of flowing blood in a given volume of the brain; CBF is defined as the volume of blood passing through the given volume of brain per unit time; MTT represent the average time for blood transiting through the given brain region; TTP is an index of time between the beginning of blood perfusion and maximum enhancement in the given region. Depending on mathematical model, Tmax (time to the peak of the residual function) or DT (delay time to the peak of the residual function) can be generated instead of TTP. Deconvolution is a commonly applied post-processing mathematical process whereby the brain tissue contrast concentration-time curves from each pixel are 'scaled' to the tissue concentration-time curve from a feeding artery (arterial input function). This gives each pixel a residual function tissue concentration-time curve that is used to measure parameters such as CBF, Tmax and DT.
In ischemic stroke, reduction of perfusion occurs, typically in an affected vascular territory (focal cerebral hypoperfusion). Regions with hypoperfusion are shown as decreased CBF, decreased CBV, prolonged MTT, and prolonged measures of contrast transit such as TTP, Tmax or DT. Since these parametric changes are detectable minutes after stroke onset, they are of great use for early diagnosis of ischemic stroke. More importantly, perfusion parameters can be used to differentiate ischemic penumbra from infarct core. Penumbra refers to area with hypoperfusion severe enough to cause neuronal dysfunction (and clinical symptoms), but still salvageable if blood supply is restored promptly. Salvage of penumbra, which is the target of thrombolytic/reperfusion treatment, correlates with better clinical outcome. Infarct core, on the other hand, is tissue that is severely hypoperfused and already irreversibly injured. With perfusion maps, penumbra can be estimated by delayed MTT/TTP/Tmax/DT but sufficient CBV/CBF,3,4 while infarct core can be delineated as severely delayed MTT/TTP/Tmax/DT and insufficient CBV/CBF.5
Currently, there are two perfusion approaches with good application in acute stroke, Magnetic Resonance (MR) perfusion and Computed Tomography (CT) perfusion. Compared the two methods, CT perfusion (CTP) has the advantage of rapidity and wide accessibility in emergency room.6 Thus, it is promising to apply CTP as a routine examination for acute stroke patients. For neurologists, the challenge would be to interpret CTP results properly. To help them achieve this goal, in this article, we will illustrate CTP patterns of stroke with a case by case approach.
Imaging protocol
Generally, CTP parametric maps are generated in 2 steps. The first step is image acquisition. It involves the intravenous administration of non-diffusible contrast. By tracking the contrast through capillaries, a time-contrast curve is acquired. The second step is post-processing the time-contrast curve by mathematical models to derive hemodynamic parameters.
For the cases shown in this paper, we used the following acquisition protocol and post-processing algorithms. CT perfusion was performed on 320-slice scanner (Toshiba Aquilion ONE). With each time point acquisition, a total of 320 slices were obtained with the thickness of 0.5 mm, which covers the whole brain (160 mm total coverage). Typically, 19 time points were obtained commencing four seconds after non-ionic iodinated contrast injection into an antecubital vein (50 mL, 5 mL/s; Bayer HealthCare). The acquisition parameters were 80 kilovolt (peak; kVp) and 100 mA. This acquisition also allows generation of intracranial angiographic data as well as perfusion maps. Whole brain non-contrast CT (NCCT) was performed before CTP. After acquisition, CTP data was processed by commercial software Mistar (Apollo Medical Imaging Technology). The mathematical model of delay-corrected singular value decomposition (dSVD) was chose to generate perfusion parameters, which were presented as CBV, CBF, MTT, and DT.
We further generated penumbra/core map by setting thresholds to parametric maps. Although there is still not universal consensus about the ideal thresholds for these perfusion maps to define penumbra and core, our previous studies3-5 have validated that cerebral region with CBF <40% optimally represents infarct core, whereas region with DT >2 seconds and CBF >40% most accurately defines penumbra.
Classical CTP patterns of stroke
Ischemic stroke is most commonly from an occlusion of the middle cerebral artery (MCA). In those with a proximal (M1 or M2) segment occlusion, there are two classical types of perfusion pattern.
Favorable pattern
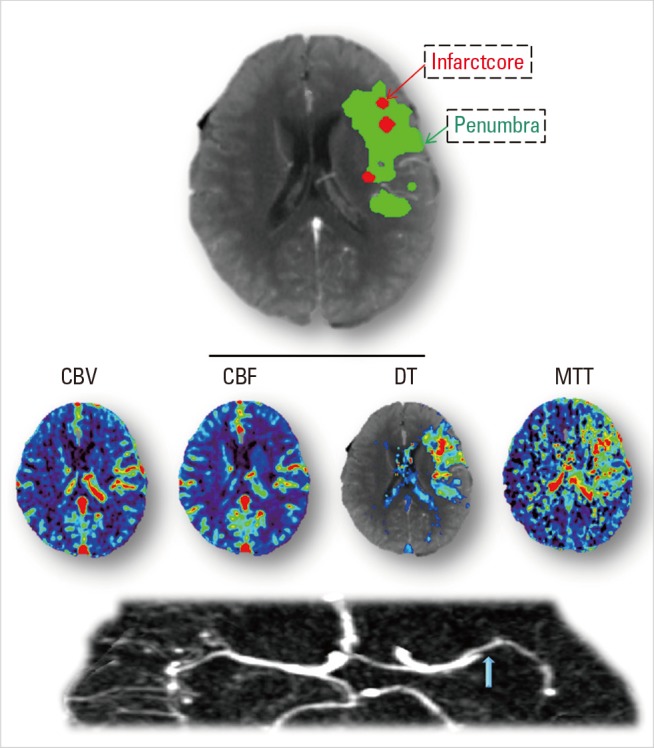
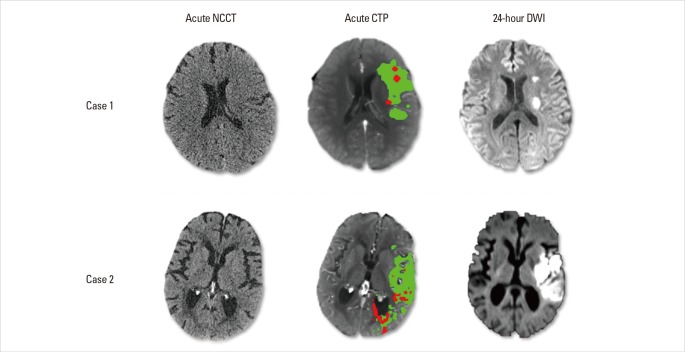
The favorable pattern refers to a 'small core and big penumbra' on CTP, shown in Case 1 and Case 2 (Figures 1 and 2). Case 1 is a 63-year-old female, admitted to hospital with sleep-onset stroke. Her neurologic deficit was severe, with NIH stroke scale (NIHSS) of 20. No abnormality was observed on NCCT (suggesting stroke likely occurred not long before awakening). CTA showed occlusion of the proximal M2 segment of left MCA, with corresponding hypoperfusion on CTP maps (Figure 1). Visual assessment of CTP showed a small region with decreased CBF and CBV, but a much bigger area with prolonged DT and MTT. Quantitative calculation of CTP maps showed only a few regions of infarct core (i.e. with severely reduced CBF below the threshold), surrounded by large regions of penumbra (i.e. with prolonged DT above the threshold). Although onset time was unclear, thrombolytic treatment (t-PA) was given to this patient based on the favourable tissue imaging pattern. A dramatic clinical recovery was observed as NIHSS dropped to 2 at 24 hours, with complete reperfusion and recanalization of the MCA observed. Follow-up MR diffusion-weighted image (DWI) showed only a small infarct, consistent with the baseline CTP core prediction (Figure 2). This indicates that penumbra was successfully salvaged from progression to infarction through successful thrombolysis. However, such success is not always achieved, as seen in Case 2. Case 2 is a 78-year-old female, imaged two hours after stroke onset, with a distal M1 occlusion, and an NIHSS of 17. CTP showed a similar pattern to case 1 (big penumbra and small infarct core, Figure 2). Thrombolysis with IV t-PA was also given but no reperfusion occurred and follow-up DWI showed that virtually all the penumbra progressed to infarction (Figure 2). There was no clinical recovery.
These two cases illustrate following two points: 1) For patients with a favourable pattern on acute CTP, they have the potential of benefiting from thrombolytic treatment. 2) However, whether the treatment leads to a good outcome depends on whether reperfusion is achieved in a timely fashion. Successful early reperfusion leads to salvage of the penumbra, a small final infarct and good clinical recovery; lack of reperfusion leads to a much bigger final infarct (recruiting initial penumbral area), and lack of clinical recovery. Notably, a small core/large penumbra pattern on CTP may be seen <3 hours after stroke, but can commonly be observed in patients outside the current 3 or 4.5 hour time window of thrombolytic therapy. Although unproven, this suggests that some patients may still respond to acute reperfusion therapy outside the standard time window.
Unfavorable pattern
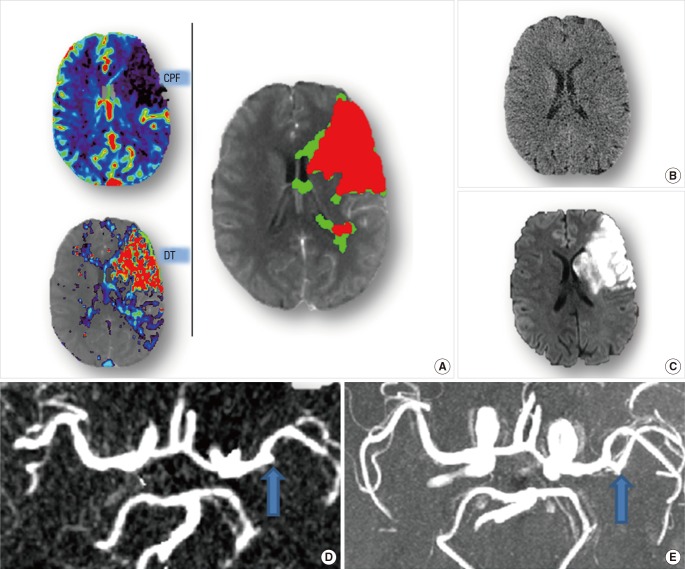
An unfavorable pattern is one with a 'big infarct core and small penumbra'. Such a pattern was observed in Case 3 (Figure 3). Case 3 is a 54-year-old male, imaged with multimodal CT 4 hours after stroke onset. There was only minor, subtle change seen on NCCT (Figure 3B), but acute CTP showed severe hypoperfusion, with the region of prolonged DT matching the region of severely reduced CBF. Therefore, the infarct core affected virtually all of the M2 MCA territory, with very small amount of salvageable tissue (Figure 3A). Although thrombolytic treatment was given to this patient and recanalization was achieved (Figure 3D, E), no clinical improvement was observed (NIHSS maintained at 18 from acute to 24 hours). Thus, recanalization failed to lead to improved outcome in this case and could be considered futile reperfusion.
Lessons learned from this case are as follows: 1) For patients with unfavorable CTP pattern, their room for clinical improvement is limited. 2) Treatment would be futile (and perhaps harmful, with increased risk of haemorrhage), even if reperfusion is achieved. Notably, this pattern can be seen early after stroke onset (within 4.5 hours). This is one of the major reasons that patients do not always benefit from thrombolysis within the standard window time.
In summary, the two major perfusion patterns (favorable versus unfavorable) have completely different response to treatment. This challenges current treatment guidelines for acute stroke patients. Currently, onset time is the major selection criterion for intravenous thrombolysis.7 One problem is that we treat patients in the current window often without knowing whether they have a 'favourable' (small core/large penumbra) or 'unfavourable' (large core/small penumbra) pattern. Thus, we have no way of predicting response in an individual patient. We rely on the principal that treating as many people as fast as possible will benefit at least some of them. Unfortunately, even treating patients within 90 minutes still means only 1 in 3 benefit. The other problem with the current time-based approach is that we exclude patients with a 'favourable' pattern if they have onset time >4.5 hours or they have an unclear onset time. Studies have validated that the existence and duration of penumbra differs from patient to patient, varying from 3 hours to 48 hours after stroke onset.8 Take Case1 for example, ordinarily, this patient would receive no thrombolysis based upon conventional selection. However, based on the CTP finding of a favourable CTP pattern, t-PA was given to this patient resulting in an almost complete clinical recovery. Therefore, perfusion pattern is promising to replace time window to select stroke patients for thrombolytic treatment. The next step is to generate level 1 evidence for such a treatment selection approach.
Intermediate CTP pattern
To design trials to produce level 1 evidence for core/penumbra selection for acute reperfusion therapies, one grey area cannot be avoided. That is the existence of what we call the 'intermediate pattern' of CTP in acute stroke. This refers to patients with a 'moderate-sized core and moderate-sized penumbra'. A typical example can be seen in Case 4 (Figure 4), who had a similar size of infarct core and penumbra. For such patients, we do not really have much data on the extent of the benefit from reperfusion treatment. They are generally less likely to have an excellent clinical outcome (e.g. Rankin Score 0-1), but it is possible we may 'shift' them from a Rankin Score 5 or 4 to a 3 for example. Overall, this is a difficult area, for both clinical trials and clinical practice, but also a very important area requiring further studies. In particular, cut-off points should be defined to differentiate 'small' penumbra (minimal benefit from reperfusion) from 'moderate' penumbra (likely to have some benefit from reperfusion). At the moment, we do not deny such patients thrombolysis if they fulfill the standard treatment criteria.
Other CTP patterns
Besides the classical stroke patterns, in acute clinical practice, sometimes we see other patterns on CTP. These less common CTP stroke patterns relate to lesion size, topography, or timing of CTP.
Malignant CTP pattern
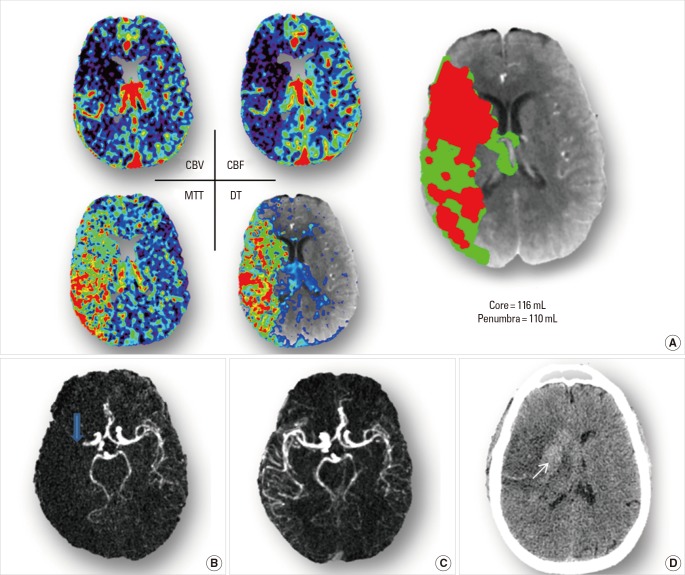
Malignant stroke refers to an extensive severely ischemic lesion in the anterior circulation, and is associated with poor outcome. This phenomenon was first observed on NCCT with hypodensity greater than 1/3 of the MCA territory, known as "one-third rule".9 Later, the malignant infarction was defined as DWI lesion >145 mL.10 Then, from advanced MR technology, the concept of malignant mismatch profile was formally raised.11 This was where, despite the existence of significant penumbra, there was a large DWI (>100 mL) and/or a large perfusion lesion (>100 mL) with severe delay in contrast transit (>8 seconds). Recently, the same group found that there appeared no benefit of reperfusion with DWI lesions above 80 mL, or if the tissue with severe delay was >85 mL.12 Perfusion areas with severe delay relate to very poor collateral supply, and are likely to infarct even with reperfusion. Thus, patients with a malignant profile have poor outcome regardless of treatment; moreover, reperfusion of such lesions may even be associated with worse outcome (due to hemorrhage). So far, information about 'malignant patterns' mostly comes from MR research. There is no clear definition of the malignant profile of CTP, although one study13 suggested that a large core (>53 mL) was associated with a higher risk of ICH. Nonetheless, given the good data for strong correlation between CTP infarct core and DWI,3,5 and the similarity of parameter measures on CT an MR perfusion maps,14 similar criteria could be adopted from MR to CTP to predict poor treatment response. A malignant pattern of CTP is shown in Case 5 (Figure 5A).
Case 5 is 58-year-old male, imaged at one hour after stroke onset. NIHSS examination result a score of 17. CTA showed an occlusion of MCA-M1 (Figure 5B), and CTP maps revealed a perfusion lesion of the whole MCA territory (Figure 5A). Whole-brain volume of infarct core was 116 mL, although he still had considerable penumbral tissue (110 mL). t-PA was given to the patient as he was very early within the time window, and recanalization was achieved (Figure 5C). However, no clinical improvement was observed. His NIHSS score was 19 at 24 hour. Moreover, after treatment, follow-up NCCT showed a hemorrhagic transformation (Figure 5D). He had a modified Rankin score of 5 at three months and required institutional care.
Lacunar stroke
Lacunar stroke, caused by occlusion of small penetrating artery, contributes to 15% of all ischemic strokes.15 Typically, lacunar lesion is smaller than 1.8 mL or 15 mm in diameter.16 Thus, for imaging to detect lacunar infarction, high spatial resolution is required. Diffusion MR (DWI) meets the requirement, detecting acute lacunar stroke with high sensitivity and specificity, both over 90%.17 Perfusion MR, on the other hand, does not perform so well.18 Neither does perfusion CT. Low sensitivity for detection lacunar lesion has been observed in CTP images with limited slice coverage.19 There are two explanations for this. Firstly, limited slice CTP (16-64 slices) only covers 40-80 mm of brain, so lesions may be outside the slice coverage. Additionally, the CTP data is acquired with slice thickness of 5-10 mm, thus the lacunar lesion may be missed due to partial volume effect, mixing of affected tissue pixels with adjacent normal pixels.
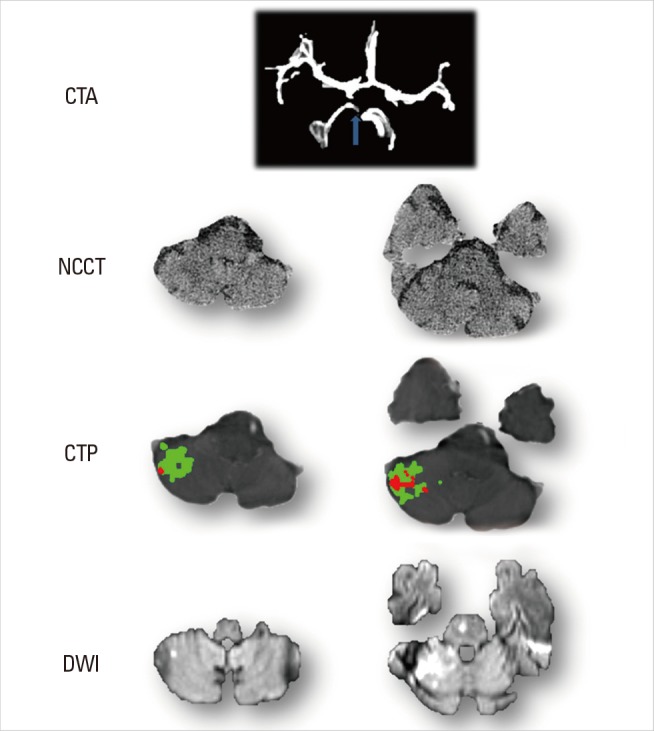
With newer technology, such as 320-slice CTP, sensitivity of detecting lacunar lesion is increased. 320-slice CTP has whole brain coverage and thin-slice (0.5-1 mm) acquisition, reducing partial volume effect.20,21 Thus, we often can see altered perfusion in the periventricular white matter. However, the specificity of detecting acute lacunar ischaemic is still lower than DWI. It is difficult to distinguish a true acute perfusion lesion from 'noise', because thin-slice acquisition causes low signal to noise ratio. This is particularly an issue with lacunar infarction located in white matter, since white matter is more prone to noise due to lower flow rates and hence less signal to noise. Distinguishing between noise and true lesion appears especially a problem with CBV, CBF and MTT maps, whereas in our experience, the DT maps perform better (Figure 6). However, DWI is clearly superior to CTP in diagnosing lacunar stroke (Figure 6).
Nevertheless, CTP may be useful to predict progression of lacunar stroke. Neurological deterioration happens in a proportion of patients with lacunar infarction (e.g. capsular warning syndrome). Such group of patients have been reported to have lower CBF value and higher MTT value inside the lesion.22 With further validation, severity of hypoperfusion may potentially divide lacunar stroke into two types: those at risk of progression and those with stable disease. In our experience, Delay Time may be the most useful map to identify and predict progression of lacunar stroke.
Posterior circulation stroke
Posterior circulation stroke is often difficult to diagnose clinically,23 since patients often present with non-specific symptoms, such as dizziness, nausea, and vomiting. Traditionally, CTP was thought to play no useful role in diagnosis of posterior circulation stroke, because of limited brain coverage. However, this thinking is outdated with the availability of whole-brain-coverage 'mega-slice' CT scanners such as the Toshiba 320-slice CT scanner.20,21 Although this has only been addressed in case reports so far,24,25 based on our experience, we can not only identify patients with posterior circulation ischemia but also we may be able to identify the presence of a favorable penumbral pattern. However, the criteria for a favorable penumbral pattern may be different both in terms of volume of core and penumbra and the perfusion thresholds used to derive them. The following case is an example.
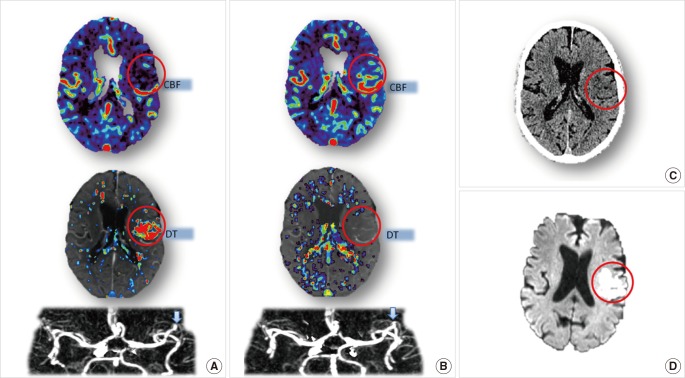
Case 7, an 87-year-old male, imaged two hours after sudden onset of dizziness. Physical examination showed disordered coordination. He was then scanned by multi-model CT, including NCCT, CTA and CTP. Occlusion was observed on right superior cerebellar artery (SCA, Figure 7), but no obvious lesion was shown on NCCT at this early stage (Figure 7). 320-slice CTP revealed the prolonged DT in the right SCA territory, and quantitative calculation suggested most of this tissue was still penumbral (Figure 7). This patient received IV t-PA treatment, with complete recovery within 24 hours and recanalization of the SCA on MRA with only a small DWI lesion (Figure 7).
Reperfusion prior to CTP
Most published CTP studies are about the hyperacute/acute phase of stroke. Less attention has focused upon the performance of stroke CTP after thrombolysis. At our center, we often perform CTP at 24 hours after thrombolysis. In many of these cases, we have observed a "false normal" phenomenon. That is, due to successful reperfusion, hemodynamic parameters of infarct area on CTP return to normal level or even higher level (hyperperfusion).
A typical example is seen in Case 8, a 79-year-old male with sudden onset of left MCA symptoms. On admission, acute CTP was performed and showed a lesion with prolonged DT and reduced CBF on MCA territory (Figure 8A). Thrombolytic treatment was given to the patient, and recanalization was achieved. Follow-up image, 24-hour DWI and NCCT, showed the remained infarct lesion (Figure 8C, D). However, no lesion was observed on 24-hour CTP. The lesion area of DWI had normal DT and CBF parameters (Figure 8B). The underlying mechanism is that blood flow of infarct area returns to normal level. The restoration might be from reperfusion with recanalization of occluded artery, from revascularization with development of collateral flow or, or from blood brain barrier injury. It is non-nutritional though, since cerebral tissue has already infarcted.
Notably, we have observed this phenomenon is not limited to post-thrombolysis CTP and may be observed more acutely. For example it can occur in acute stroke patients with spontaneous reperfusion before (or during) CTP scanning. In that case, one cannot make an accurate measure of infarct core with CTP, as CTP (opposed to DWI) relies on the presence of hypoperfusion to measure core. Unfortunately, this phenomenon is not well appreciated by many stroke clinicians or radiologists, and may lead to false negative diagnosis of ischemic lesion on CTP. A typical example is Case 9.
Case 9 is a 34-year-old male, who was admitted to hospital within 3 hour of stroke onset, and scanned by multi-model CT immediately. His NIHSS was 8 at admission but dropped to 1 immediately after scanning. Thus, we suspected that spontaneous reperfusion happened before or during CT scanning. No perfusion lesion was detected on the acute CTP parametric maps (Figure 9A), but the CTP source image (CTPSI) did show hypodensity in the right lentiform (Figure 9B) despite no obvious hypodensity on NCCT. We have noticed that the CTPSI is more sensitive at detecting early hypodensity than NCCT.26 Follow-up DWI confirmed the existence of the lesion (Figure 9C).
To avoid misinterpretation of CTP results, in clinical practice, the 'reperfusion pattern' should be recognized. If CTP is performed acutely and there is already established hypodensity on CTPSI +/- NCCT, the absence of a perfusion abnormality on CTP indicating reperfusion has occurred. Such patients should not, in our opinion, be given thrombolytic treatment.
Conclusion
Perfusion pattern varies among stroke subtypes. For stroke from MCA occlusion, which is the most common type, acute CTP has a high sensitivity and specificity of detecting the lesion. Moreover, it provides information of core and penumbra which may be used to guide thrombolytic treatment.27 Regarding other stroke subtypes, such as lacunar stroke, posterior circulation stroke, and in the setting of 'reperfusion in progression', the exact role of CTP has not been validated yet. More research should be encouraged on these topics. Clinically, from our experience, to manage such patients, it is important to combine CTP with the clinical picture as well the NCCT and CTA data.