


Introduction
Blood vessels become tortuous when the arterial wall expands and lengthens upon becoming weak due to decreased axial strain, which is associated with several causes, including vascular risk factors, such as aging, hypertension, and genetic factors. Another pathomechanism is high wall shear stress (WSS) caused by increased blood flow; as vessel wall remodeling occurs to reduce the WSS to baseline levels, arterial lengthening and expanded diameter cause the vessel to become tortuous [1,2]. High WSS also causes vascular pathologies, such as intracranial aneurysms (IAs) [3]. Arterial tortuosity is a hallmark of inherited arteriopathy, including fibromuscular dysplasia, and is associated with a high incidence of IAs [1,4,5]. Based on previous studies, the severe tortuosity of a cerebral vessel has been strongly associated with the occurrence [6-10] and outcome of the IA[11,12].
Various methods have been proposed for the analysis of tortuosity in two-dimensional (2D) and three-dimensional (3D) [1,13,14]. Although 3D analysis of the tortuosity is more accurate than 2D analysis, previous studies usually used 2D analysis.
IA is preferentially located at the outer curvatures and bifurcations that are exposed to major hemodynamic forces [15,16]. Considering the higher arterial tortuosity and large WSS, we can assume that the hemodynamic influence of the increased tortuosity index (TI) will be significant in the development of outer curvature type cerebral aneurysms [17]. To the best of our knowledge, no studies have analyzed the impact of tortuosity on the occurrence of IA according to differences in hemodynamic location. Therefore, we analyzed the relationship between tortuosity and the occurrence of IA according to the hemodynamic location using 3D analysis and confirmed that only the outer curvature type, and not the bifurcation type, was associated with cerebral vessel tortuosity. This tortuosity could also affect the outcomes of IAs treated with endovascular coiling.
Methods
Subjects
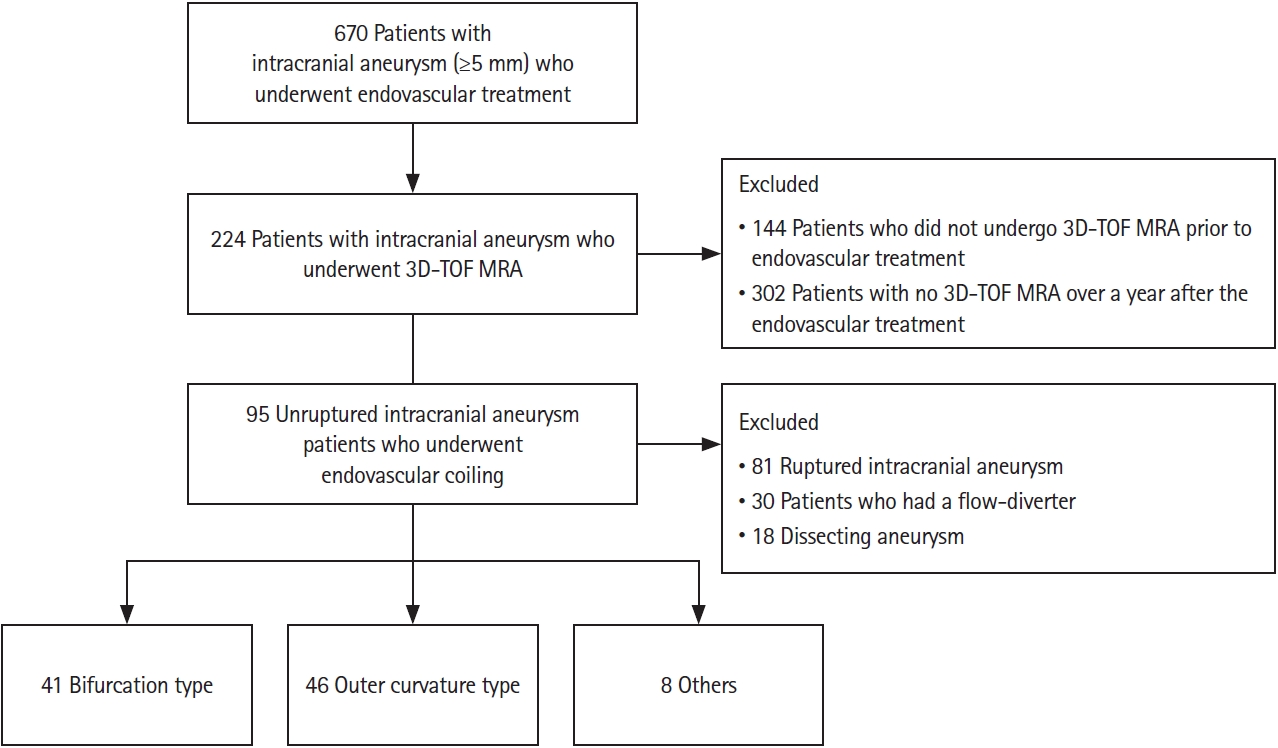
We retrospectively enrolled consecutive patients with IA who were treated with endovascular coiling at the Samsung Medical Center, Seoul, Korea, between January 2014 and December 2017. All patients underwent 3D time-of-flight (TOF) magnetic resonance angiography (MRA) and digital subtraction angiography (DSA) and were followed up for more than a year. Ninety- five subjects, at a 1:1 ratio to IA, without any brain disease who visited our institution’s health promotion center, were enrolled as control subjects. Healthy controls were selected as cases that matched for age and sex. We excluded patients with a ruptured aneurysm, dissecting aneurysm, endovascular treatment with a flow-diverter, and/or patients who could not confirm recanalization of coiled aneurysm since they had no 3D-TOF MRA, more than 1 year after the endovascular treatment (Figure 1). Of the 224 patients with IA who underwent 3D-TOF and endovascular coiling, 95 were enrolled in the study. In total, 129 patients were excluded from the study for the following reasons: 81 patients had ruptured aneurysms, 30 patients had flow-diverters, and 18 patients had dissecting aneurysms. The 95 patients were classified into bifurcation type, outer curvature type, and others according to their hemodynamic location. In total, there were eight patients with multiple aneurysms: five cases involved patients who had received coil embolization only on one aneurysm; two cases involved a patient with multiple aneurysms in the ipsilateral paraclinoid internal carotid artery (ICA) and the larger aneurysm was set as an index aneurysm; one case involved a patient with aneurysms in the anterior communicating artery (Acom) and paraclinoid and thus was classified as others, and the larger aneurysm (paraclinoid) was set as an index aneurysm. The study protocol was approved by the local Institutional Review Board (SMC 2018-12-081). Because of the retrospective observational design of this study, informed consent from each participant was waived.
Endovascular treatment
Dual antiplatelet premedication (100 mg aspirin plus 75 mg clopidogrel) was administered to all patients with unruptured IAs. All patients were treated under general anesthesia during the endovascular treatment. Anticoagulation was initiated through an intravenous bolus injection of 2,000 to 5000 IU heparin immediately after guiding catheter placement to increase the activated clotting time from two to 2.5 times the normal range. In 57/95 patients, endovascular coiling was performed using the stent-assisted coil embolization technique with various types of coils. In the other procedures, the single- catheter technique (n=13), double-catheter technique (n=22), and other techniques (n=3), such as balloon-assisted coiling, were used based on the geometry of the aneurysm. The immediate angiographic outcomes were classified into three categories, as previously published by Roy et al. [18].
Magnetic resonance imaging protocol and analysis
All patients underwent routine brain magnetic resonance imaging (including 3D-TOF MRA of the circle of Willis) in a 3-Tesla system (Achieva, Philips Medical Systems, Best, the Netherlands) with a 32-channel sensitivity encoding (SENSE) head coil. The parameters used for 3D-TOF MRA were as follows: repetition time (TR), 25 ms; echo time (TE), 3.5 ms; flip angle, 20°; matrix, 880×332; slice thickness, 0.6 mm; field of view, 250 mm; and acquisition time, 4 minutes 53 seconds.
We defined IA as a protrusion of the cerebral vessel wall over 5 mm, with a saccular form. We excluded aneurysms of less than 5 mm and confirmed complications after endovascular treatment; thus, junctional dilatation was excluded. The size of the aneurysm was measured based on the following points: height, neck, and width (horizontal and vertical). The maximum length was used to represent the aneurysm size.
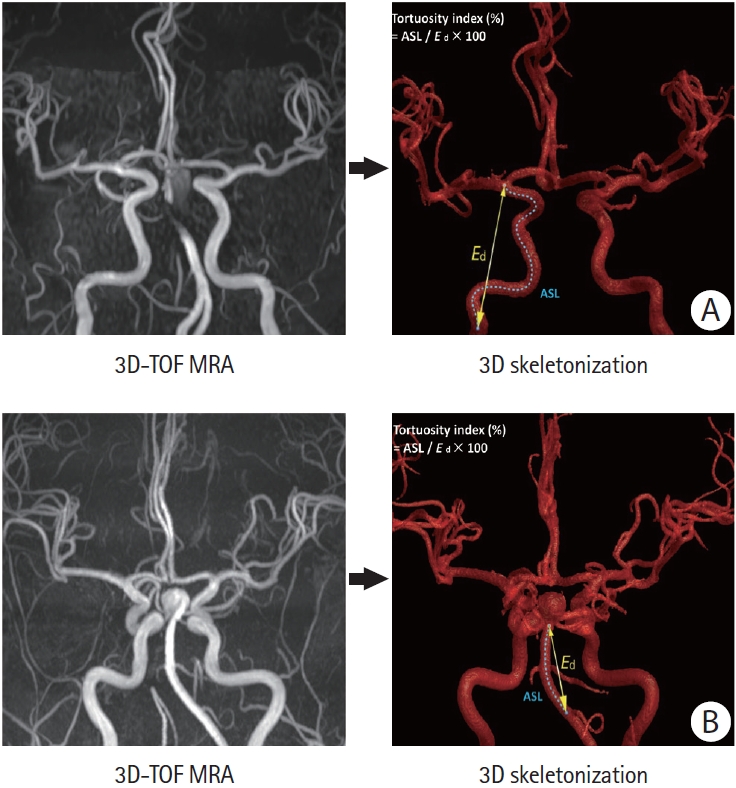
To transform and analyze 3D vascular images, we developed and used an in-house graphical user interface implemented in MATLAB 2017. 3D-TOF MRA Digital Imaging and Communications in Medicine (DICOM) data for the subjects were converted to the Neuroimaging Informatics Technology Initiative (NIf-TI) format using dcm2nii (McCausland Center for Brain Imaging, Columbia, SC, USA). The 3D skeletonization was performed using a region-growing algorithm, and the features of each arterial segment were extracted for the intracranial ICA (proximal end of petrous ICA-terminal ICA), middle cerebral artery (MCA) (terminal bifurcation-main bifurcation), anterior cerebral artery (ACA) (A1, terminal ICA-Acom), posterior cerebral artery (PCA) (P1, basilar bifurcation-posterior communicating artery), intracranial vertebral artery (VA) (proximal end of the V4 segment-vertebrobasilar junction), and basilar artery (BA) (vertebrobasilar junction-basilar bifurcation) (Supplementary Figure 1). The program provides data on the length of the true path of the arterial segment (arterial segment length [ASL]) and tortuosity of the cerebral arteries at each arterial segment. TI was the ASL divided by the Euclidean distance (Figure 2). The average TI was calculated as the average of the tortuosity values of the ICA, MCA, ACA, BA, VA, and PCA segments for each patient. The parent vessel TI was the tortuosity of the cerebral vessel located in the proximal region of the IAs (e.g., paraclinoid aneurysm—ipsilateral ICA, basilar tip aneurysm—BA), and the TI of the corresponding vessel was measured in the matched controls. All patients were serially evaluated for recanalization of the treated aneurysm for over a year. Recanalization was defined as the occurrence of a change in the Raymond- Roy classification using 3D-TOF MRA, and recanalization from complete occlusion and residual neck growth after treatment and retreatment were investigated in detail.
Statistical analysis
Fisher’s exact test or the chi-square test was used to analyze the categorical variables. Differences in continuous variables were evaluated using Student’s t-test and Wilcoxon rank-sum test. Independent factors for cerebral aneurysm and recanalization were evaluated using logistic regression analysis. Explanatory variables were considered in the univariate analyses and evaluated in a subsequent multivariate logistic analysis. A multivariate logistic regression analysis model was employed to calculate the odds ratio, 95% confidence interval (CI), and P-values after adjusting for sex, age, and vascular risk factors.
Patients with aneurysms were classified into recanalized and non-recanalized groups to explore the predictors of aneurysmal recanalization. We conducted two types of comparisons between the two groups in terms of recanalization. First, we coded the patients with binary patterns (recanalization and non-recanalization) and compared them using logistic regression analyses. Second, we performed a time-to-event analysis using Cox regression and presented it as a hazard ratio (HR). All statistical analyses were performed using SPSS version 25.0 (IBM Corp., Chicago, IL, USA) and the open-source statistical package R version 3.6.3 (R Project for Statistical Computing, Vienna, Austria).
Results
General characteristics
During the study period, a total of 670 patients underwent endovascular treatment, and 95 patients who met the inclusion criteria were screened. A total of 95 patients (56.3±11.8 years, male 25.3%) and 95 controls (56.4±11.8 years, male 25.3%) were included in this study (Table 1). The mean aneurysmal size was 10.1±4.8 mm (median 10.7; interquartile range [IQR], 7.8 to 14.9). The site of predilection for the development of aneurysm was the ICA (paraclinoid 36 [37.9%], cavernous 15 [15.7%], posterior communicating artery 7 [7.4%], anterior choroidal artery 2 [2.1%], persistent trigeminal artery 1 [1.1%]), followed by the ACA (Acom 13 [13.7%]. A1 segment 1 [1.1%]); BA (basilar tip 13 [13.7%], superior cerebellar artery 1 [1.1%], and MCA 4 [4.2%]). Patients with aneurysms had a more frequent history of hypertension, dyslipidemia, and heavier weight than the controls. Based on the location of hemodynamics, 41 (43.2%) and 46 (48.4%) patients were classified into the bifurcation and outer curvature types, respectively. The outer curvature type had a larger mean aneurysm size than the bifurcation type (10.1±5.3 for bifurcation type vs. 13.0±5.2 for outer curvature type, P=0.01).
Tortuosity index and arterial segment length according to the type and location of the aneurysm
The parent vessel TI (127.4±30.8 for bifurcation type vs. 146.1±16.2 for outer curvature type, P<0.01) and the average TI (121.41±5.64 for bifurcation type vs. 125.74±6.1 for outer curvature type, P<0.01) were higher in the outer curvature type than in the bifurcation type and compared with the control cases, the outer curvature type was significantly greater (parent vessel, P<0.01; average, P<0.01); however, there was no significant difference seen in the bifurcation type (parent vessel, P=0.92; average, P=0.40). Among the TIs by arterial segments, the BA (P=0.02), left PCA (P=0.03), left VA (P<0.01), right VA (P<0.01), and right ICA (P<0.01), there was a significant difference only in the outer curvature type, unlike the bifurcation type, compared with the control cases (Table 2).
The average ASL was not significant, but it was higher in the outer curvature type than in the bifurcation type (93.9±16.0 for bifurcation type vs. 99.8±15.8 for outer curvature type, P=0.09). This was also compared with the control cases, revealing that only the outer curvature type was significantly different (P<0.01). Among the ASLs by arterial segment, left ACA (P=0.01), BA (P<0.01), left PCA (P=0.02), left ICA (P=0.03), and right ICA (P=0.01) showed significant differences in the outer curvature type compared to the controls. The parent vessel TI, average TI, and each arterial segment (BA, right MCA, left VA, right VA, and right ICA) were independently associated with the occurrence of IAs (outer curvature type only) (Supplementary Table 1) after adjusting for sex and vascular risk factors.
Predictors of the aneurysmal recanalization
Patients with IAs were followed up for 39.6±15.7 months (median, 37.0; IQR, 12 to 65). Of the 95 follow-ups, 21 (22.1%) had recanalization of the IAs. A comparative analysis of the characteristics of patients with and without recanalization of IAs is shown in Supplementary Table 2. In the recanalization group, the bifurcation type was the most common (n=12, 29.3%), and in the non-recanalization group, the outer curvature type was the most common (n=41, 89.1%; P=0.06). Recanalization patients who underwent retreatment were also more frequent in the bifurcation type aneurysm group (8 [19.5%] for bifurcation type vs. 2 [4.4%] for outer curvature type, P=0.06). In addition, the recanalization of IAs was larger than those without recanalization of IAs (11.03±4.24 for non-recanalization vs. 14.3±7.41 for recanalization, P=0.065). On survival analysis, hemodynamic classification (reference= bifurcation type) (HR, 0.31; 95% CI, 0.11 to 0.88; P=0.03) and aneurysmal size (HR, 1.10; 95% CI, 1.02 to 1.18; P<0.01) were associated with recanalization. In terms of TI, the right ICA was inversely associated with recanalization (HR, 0.96; 95% CI, 0.92 to 0.99; P=0.03), and TI of the parent vessel showed an inverse association (HR, 0.97; 95% CI, 0.95 to 1.00; P=0.06) (Table 3). Similar trends were found in the logistic regression analyses by setting recanalization as a binary outcome (Supplementary Table 3).
Discussion
In this study, the cerebral vascular tortuosity measured by TI was higher in the IA group than in the control group, and when classified by the hemodynamic location, cerebral vessel tortuosity correlated with the occurrence of IA only in the outer curvature type. Between patients with IA and controls, the difference in TI was apparent in the cerebral arteries on the posterior circulation bed. The recanalization rate after endovascular treatment was higher for the bifurcation type, which had a lower TI than the outer curvature type. Recanalization tended to decrease as the parent vessel tortuosity increased.
Vessel tortuosity usually occurs as the weakening of the arterial wall in elderly patients with comorbidities, such as hypertension, diabetes, and atherosclerosis, or in young patients with inherited arteriopathy [19,20]. The complex action of hemodynamic stress, such as a high WSS, causes wall remodeling, which in turn results in vessel tortuosity [19-21]. Hemodynamic stress induces endothelial dysfunction, arterial wall inflammation, and remodeling, accounting for the common findings of IAs located at bifurcations or outer curvatures [22,23]. Patients with high cerebral vessel tortuosity show a high incidence of IA because vessel tortuosity and IA are caused by similar biomechanical factors.
In this study, the TI of the BA, right MCA, left and right VAs, and right ICA were higher in the IA group than in the control group. Previous studies have reported a high MCA TI in MCA aneurysms [6] and a strong correlation between BA or cervical artery tortuosity and IA formation [7-10]. In addition, our study showed higher VA tortuosity and average TI scores across all arterial segments in the IA group than in the control group. Although studies have investigated the relationship between VA tortuosity and aneurysm, they were focused on abdominal aneurysms rather than IAs. Therefore, to the best of our knowledge, this is the first report on the correlation between VA tortuosity and IA formation [24]. Compared with the control group, the IA group had a higher TI in the posterior circulation, such as in the BA and both VAs. The posterior circulation is more vulnerable to hemodynamic stress and pathologic changes such as blood pressure and dolichoectasia respectively [25].
Furthermore, while previous studies only demonstrated a correlation between IAs and certain arterial segments, our study showed that the average TI score across all arterial segments was higher in the IA group. This suggests that the IA group showed more severe tortuosity for both specific arterial segments and all cerebral vessels. Unlike other studies, we performed a 3D analysis to evaluate cerebral vessel tortuosity because it yields more precise values. This enabled us to observe correlations in the formation of IA with diverse arterial segments and the average TI score.
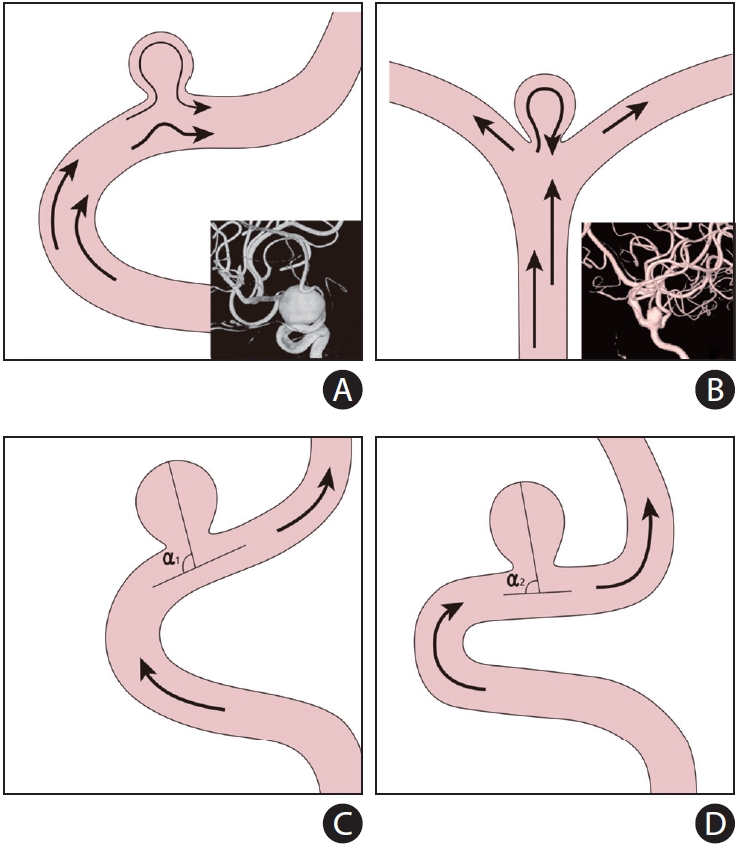
The formation of an IA is closely associated with hemodynamic factors [3,16] and typically occurs at locations with a high WSS. IAs can be divided into two groups depending on their hemodynamic locations (Figure 3A and B). When the two groups are compared, cerebral vessel tortuosity correlated with the formation of an aneurysm only in the outer curvature type and not in the bifurcation type. In both groups, aneurysms were formed at the impingement points with high WSS. However, at the outer curvature, IAs were formed due to the dilatation of the vessel wall in response to increased local hemodynamic stress in patients who showed slightly advanced diffuse arteriopathy of the cerebral vessels. In the bifurcation type, aneurysms were formed before or in the early stages of diffuse arteriopathy due to the high local WSS acting in an orthogonal direction to the bifurcation point.
Studies have investigated the effects of vessel tortuosity on the outcome of IA, and the relationship between tortuosity and rupture risk is debated [9,11,12,26]. Abdominal aortic tortuosity increases the risk of abdominal aortic aneurysm rupture [27]. Ryu et al. [12] suggested a correlation between aneurysm rupture and tortuosity based on the association between BA tortuosity and aneurysm growth in their study. Another study showed no association between cervical artery tortuosity and rupture status of IAs [9]. Krzyżewki et al. [26] reported that increased ACA tortuosity was associated with increased development of Acom aneurysms. However, as cerebral vessel tortuosity increases, the growth of the aneurysm decreases, and ACA tortuosity acts as a protective factor against the rupture of an Acom aneurysm [11,26]. Our study showed recanalization after endovascular treatment as an outcome in the IA group, while multivariate regression analysis revealed an inverse relationship between parent vessel tortuosity and recanalization. Recanalization occurred more often in the bifurcation type because it showed a lower TI than the outer curvature type. Therefore, although not statistically significant, the parent vessel TI and recanalization were inversely correlated. These results indirectly support the claim of Krzyżewki et al. [11] that ACA tortuosity is a protective factor against the rupture of an Acom aneurysm. In this study, aneurysm size correlated with recanalization, which is consistent with previous studies. Aneurysm size has been described to be related to the development of IA, and it can be used to predict the risk of rupture [28,29]. However, there was no correlation between cerebral vessel TI and aneurysm size for the outer curvature type (Pearson correlation, 0.1009; P=0.5046), suggesting that cerebral vessel tortuosity is related to the initiation of aneurysms but does not affect the growth of aneurysms. The initiation, growth, and rupture of aneurysms are affected by other hemodynamics [16,30], and when the progression of vessel tortuosity changes local hemodynamics, such as the WSS and flow angle, this can affect the growth of the aneurysm in either direction. In a previous study, a higher flow angle was associated with a higher rupture risk; increased tortuosity can reduce the flow angle, which could explain the diverse nature of the effects of tortuosity on the outcomes of aneurysm (Figure 3C and D) [26,31,32].
There are some limitations to our study. First, this was a retrospective study of patients at a single center. Second, we excluded patients who had undergone aneurysm clipping and focused on patients who had undergone endovascular treatment. Therefore, the outcomes were evaluated only in terms of aneurysm recanalization. Third, because recanalization was only analyzed using 3D-TOF MRA, rather than DSA, the accuracy may have been limited. Fourth, the control group included only age-matched and sex-matched cases. Therefore, risk factors such as hypertension, which can affect the development of aneurysms, have different incidences between the groups. Fifth, the subjects in this study were limited to patients who had an aneurysm ≥5 mm in size and underwent endovascular coiling. Therefore, there is a possibility of selection bias, and the outcomes of this study should be interpreted with caution, especially for aneurysms <5 mm in size or those that did not receive endovascular coiling. Finally, we did not measure the sum of the angle metrics. Hence, we could not precisely analyze the correlation between local tortuosity and IAs.
Conclusions
In conclusion, cerebral vessel tortuosity did not increase in any type of IA, and when classified by the hemodynamic location, only aneurysms that developed at the outer curvature showed a correlation with tortuosity. The bifurcation type, which had a low TI score, showed a higher recanalization rate. However, a more severe cerebral vessel tortuosity correlated with the occurrence of IA, but not with size and recanalization. The effects on outcomes were diverse because of changes in the local hemodynamics with increased tortuosity. Further prospective studies are necessary to confirm these results.