Dear Sir:
Arterial blood pressure is often elevated in the acute phase of intracerebral hemorrhage (ICH). It is a predictor of a poor prognosis [
1]. The Intensive Blood Pressure Reduction in Acute Cerebral Hemorrhage Trial II (INTERACT II) study revealed a strong tendency towards improved outcomes in ICH patients subjected to intensive blood pressure lowering [
1], while the Antihypertensive Treatment of Acute Cerebral Hemorrhage Trial II (ATACH II) trial reported worse outcomes [
2]. So far, the pathophysiologic consequences of intensive blood pressure lowering in acute ICH are scarcely understood. Here we describe an experimental model with translational reference to the INTERACT II and ATACH II trials. Our study allows for rapid blood pressure lowering 30 minutes after ICH induction in rats. We aimed at assessing hematoma volume and functional outcome and evaluated histological and magnetic resonance imaging (MRI) parameters, including edema formation and blood-brain barrier dysfunction.
For this study 84 spontaneously hypertensive rats (SHR) were used. A detailed methodical description can be found in
Supplementary methods. In brief, striatal ICH was induced by stereotactic collagenase injection [
3,
4]. SHR were then randomized into an interventional group (intensive blood pressure lowering by nifedipine orally to 126.0┬▒8.8 mm Hg systolic) and a control group (saline orally; 186.0┬▒9.8 mm Hg systolic) (
Supplementary Figure 1). Hematoma volume as the primary endpoint was quantified photometrically 24 hours after ICH induction (end of main hematoma expansion phase). Neurological deficits were evaluated before sacrifice by a blinded rater using the modified Neurological Severity Score (mNSS). Additional histopathological analysis evaluated edema formation and blood brain barrier dysfunction at 24 and 72 hours after ICH induction (
Supplementary Table 1). Ordinal histoscores were calculated using a semi-quantitative assessment (
Supplementary methods 1).
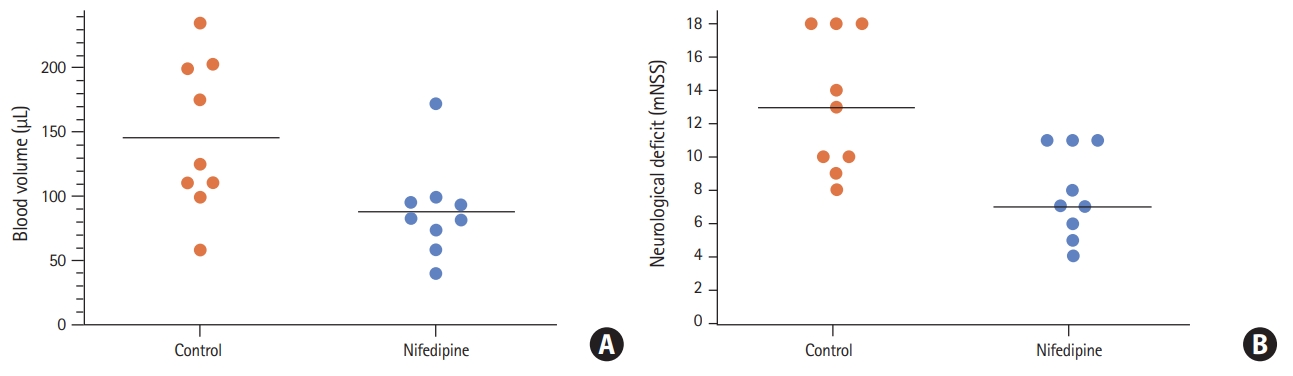
Intensive blood pressure lowering reduced hematoma volume 24 hours after ICH induction (nifedipine group 88.6┬▒36.6 ╬╝L vs. control group 146.3┬▒58.7 ╬╝L,
P=0.023, n=9) (
Figure 1A). This implicated a decrease in hematoma growth within the first 24 hours by nifedipine. Neurological deficits were significantly reduced 24 hours after ICH induction in the interventional group as compared to controls (median, 7 [interquartile range, IQR, 5.5 to 11] vs. 13 [IQR, 9.5 to 18];
P=0.011, n=9) (
Figure 1B).
Histopathological analyses revealed no differences in edema formation at 24 hours (histoscore: nifedipine median, 2 [IQR, 2 to 3] vs. control 3 [IQR, 2 to 3];
P=0.99, n=5) and 72 hours (nifedipine median, 1 [IQR, 0.5 to 2] vs. control 1 [IQR, 0.5 to 2],
P=0.99, n=5) (
Supplementary Figures 2 and
3). Concerning the extent of blood-brain barrier disruption the size of the areas showing positive immunoglobulin G staining did not differ between groups at 24 hours (histoscore: nifedipine median, 3 [IQR, 3 to 4] vs. control 3 [IQR 2 to 4],
P=0.99, n=5) and 72 hours (nifedipine, 3 [IQR, 2 to 3] vs. control 2 [IQR, 1.5 to 3],
P=0.68, n=5) (
Supplementary Figures 2 and
3). An additional descriptive MRI of post-mortem rat brains confirmed findings (
Supplementary Figure 4).
Our experimental data suggest that intensive blood pressure lowering in the acute phase of ICH reduces hematoma volume and improves functional neurological deficits. We did not find a significant effect of the treatment on edema formation and blood-brain barrier dysfunction up to 72 hours after ICH induction.
From a translational perspective, the rapid drop of blood pressure after nifedipine administration was well comparable to what has been achieved in clinical trials (although different in its absolute size) [
1,
2]. We consider it unlikely that nifedipine has other effects on hematoma volume and functional outcome than what is mediated via blood pressure. Moreover, calcium channel blockers were also used in the pivotal clinical trials [
1,
2]. In experimental ICH, bleeding begins around 10 minutes after collagenase injection. Thus, our model well covers blood pressure lowering during the phase of hematoma expansion [
3-
5].
The effect of rapid blood pressure lowering on functional outcome after ICH is not consistent between clinical and translational studies. On the clinical side, INTERACT II reported a strong trend towards a benefit of the intervention whereas ATACH II reported neutral or even worse outcomes [
1,
2]. The animal data in contrast affirms that blood pressure reduction translates into a better functional outcome. In fact, in the ATACH II trial more complications occurred in the intensively treated group such as increased frequency of kidney failure [
1,
2]. However, our model was not designed to capture systemic complications of intensive blood pressure lowering.
We did not observe differences in other pathophysiological cascades that take place in the perilesional tissue after ICH formation (especially edema formation and blood brain barrier disruption). It appears that the most critical mediator of the therapeutic effect of intensive blood pressure lowering is the reduction in hematoma volume. However, our model can be applied to future studies evaluating the pathophysiology of blood pressure lowering in acute ICH in more detail.
Limitations include missing longitudinal outcome data to prove long-term therapeutic effects (in line with 90 days outcome of the randomized trials) of the intervention. Furthermore, we may have overestimated the therapeutic effect size of the intervention because the control group was untreated, thus having higher blood pressure values than the control groups of the pivotal clinical trials [
1,
2].
In conclusion, blood pressure lowering with nifedipine decreases ICH volume and improves behavioral outcomes in SHR. Our findings may help to refine future clinical studies on blood pressure reduction in ICH patients.
Supplementary materials
Supplementary┬ĀFigure┬Ā1.
Blood pressure evaluation (tail-cuff method). (A) Systolic blood pressure values (mm Hg) of spontaneously hypertensive rats stratified according to age (weeks). In addition to individual data points, mean values are given (black lines). Intracerebral hemorrhage experiments were performed with rats aged 10 weeks (blue symbols). (B) Perioperative systolic blood pressure values. Systolic blood pressure values (mm Hg) before (pre-operative, red symbols), during (1st-10th minute, 20th-30th minute, blue symbols) and after (post-operative, blue symbols) isoflurane anesthesia. In addition to individual data points, mean values are given (black lines). (C) Blood pressure lowering with nifedipine orally over 72 hours (intervention). Systolic blood pressure values (mm Hg) before (red symbols) and during the application of nifedipine (15 mg/kg body weight, blue symbols) via a nasogastric tube (every 8 hours during the first 24 hours, every 12 hours thereafter). In addition to individual data points, mean values are given (black lines). (D) Blood pressure levels during placebo application orally over 72 hours (control group). Systolic blood pressure values (mm Hg) before (red symbols) and during the application of saline as placebo via a nasogastric tube (every 8 hours during the first 24 hours, every 12 hours thereafter). Treatment and application volume were equal to nifedipine-treated rats. In addition to individual data points, mean values are given (black lines).
Supplementary┬ĀFigure┬Ā2.
Representative hematoxylin eosin (HE) and antirat-immunoglobulin G (IgG) staining sections for the intensive blood pressure lowering vs. control group. Representative HE and anti-rat-IgG staining sections for the intensive blood pressure lowering group (nifedipine, left side) and the control group (right side). No differences were found for edema formation (determined on HE sections) and for blood brain barrier dysfunction (as determined by anti-rat IgG immunohistochemical stainings) between the groups. Whole brain sections are depicted at original magnification 10 (bars=200 ┬Ąm) and smaller images with magnification 2 in the upper left corner for orientation.
Supplementary┬ĀFigure┬Ā3.
Histopathological analysis using a semiquantitative histoscore. Ordinal histoscores were calculated using a semi-quantit ative assessment for edema formation (hematoxylin eosin [HE] staining, brain edema reflected by vacuolated tissue around the hemorrhage compatible with vasogenic brain edema: 0=isolated hemorrhage without vacuolated tissue, reflecting brain edema; 1=edema minimal, means partial vacuolated tissue around hemorrhage, no consecutive midline shift; 2=edema minimal to medium with vacuolated tissue involving cortex, no consecutive midline shift; 3=edema medium to strong with consecutive midline shift; 4=strong edema bilateral, midline shift) and blood brain barrier dysfunction (immunoglobulin G [IgG] staining, intraparenchymatous deposits of IgG as indirect marker of blood brain barrier dysfunction: 0=isolated hemorrhage, extravasation absent; 1=extravasation and blood-brain-barrier breakdown minimal; 2=extravasation minimal to medium; 3=extravasation medium to strong; 4=extravasation strong and bilateral). Six slides per brain prepared from needle entry site ┬▒1 mm were analyzed. The slides were evaluated in blinded random order with a standard light microscopy. (A) No differences in edema formation at 24 hours (P=0.99, n=5) and 72 hours (P=0.99, n=5). (B) Concerning the extent of blood-brain barrier disruption the size of the areas showing positive IgG staining did not differ between groups at 24 hours (P=0.99, n=5) and 72 hours (P=0.68, n=5). Median scores and scatter dot plot are presented.
Supplementary┬ĀFigure┬Ā4.
Explorative magnetic resonance imaging (MRI)- based edema quantification 24 hours after intracerebral hemorrhage (ICH) induction. Representative magnetic resonance image (T2) of two fixed rat heads 24 hours after ICH induction with comparable hematoma volume around 90 ┬ĄL. (A) Control group without blood pressure lowering and (B) with intensive blood pressure lowering (nifedipine-treated). The calculated edema volume in both MRIs was around 20 ┬ĄL (blue area). Afterwards histopathological analysis (hematoxylin eosin [HE] staining) from the same brains confirmed imaging results.
Acknowledgments
Michel Mittelbronn would like to thank the Luxembourg National Research Fond (FNR) for the support (FNR PEARL P16/BM/11192868 grant). This study was supported in part by a grant from the Goethe University Hospital Frankfurt.
Figure┬Ā1.
(A) Hematoma volume (┬ĄL) 24 hours after intracerebral hemorrhage (ICH) induction in rats subjected to intensive blood pressure lowering (nifedipine) versus controls (P=0.02, n=9). Individual data points and mean values are given. (B) Neurological deficits 24 hours after ICH induction in rats subjected to intensive blood pressure lowering (nifedipine) versus controls (P=0.01). Individual data points and median values are given. mNSS, modified Neurological Severity Score.
References
1. Anderson CS, Heeley E, Huang Y, Wang J, Stapf C, Delcourt C, et al. Rapid blood-pressure lowering in patients with acute intracerebral hemorrhage.
N Engl J Med 2013;368:2355-2365.


2. Qureshi AI, Palesch YY, Barsan WG, Hanley DF, Hsu CY, Martin RL, et al. Intensive blood-pressure lowering in patients with acute cerebral hemorrhage.
N Engl J Med 2016;375:1033-1043.

3. Rosenberg GA, Mun-Bryce S, Wesley M, Kornfeld M. Collagenase-induced intracerebral hemorrhage in rats.
Stroke 1990;21:801-807.
4. Foerch C, Arai K, Jin G, Park KP, Pallast S, van Leyen K, et al. Experimental model of warfarin-associated intracerebral hemorrhage.
Stroke 2008;39:3397-3404.
5. hou W, Schwarting S, Illanes S, Liesz A, Middelhoff M, Zorn M, et al. Hemostatic therapy in experimental intracerebral hemorrhage associated with the direct thrombin inhibitor dabigatran.
Stroke 2011;42:3594-3599.